

In my Discord there is a Trade Analysis dashboard that includes a number of different scanners.
Today I want to introduce to two of them. There are five in total. These are not new, they are part of my trading platform and have been available since I started my Discord.
The flow data tells you what institutions are doing in the options market. Judah’s Scanner and the Momentum Scanner give you the chart context underneath it. Both tools run against the same broad universe screened each morning, so when a name shows up in flow and in one of these tools at the same time, you have two independent reads pointing in the same direction.
Judah’s Scanner
The Flow Screener and Daily Screen in this Dashboard rank names by composite technical score. Judah’s Scanner does something different. It takes the same daily universe and sorts every name into one of five buckets based on where it is in its cycle. A VCP coiling near its highs and a name recovering from a base are both worth knowing about, but they require different timing and different risk parameters. The buckets make that clear before you spend any time on the chart.
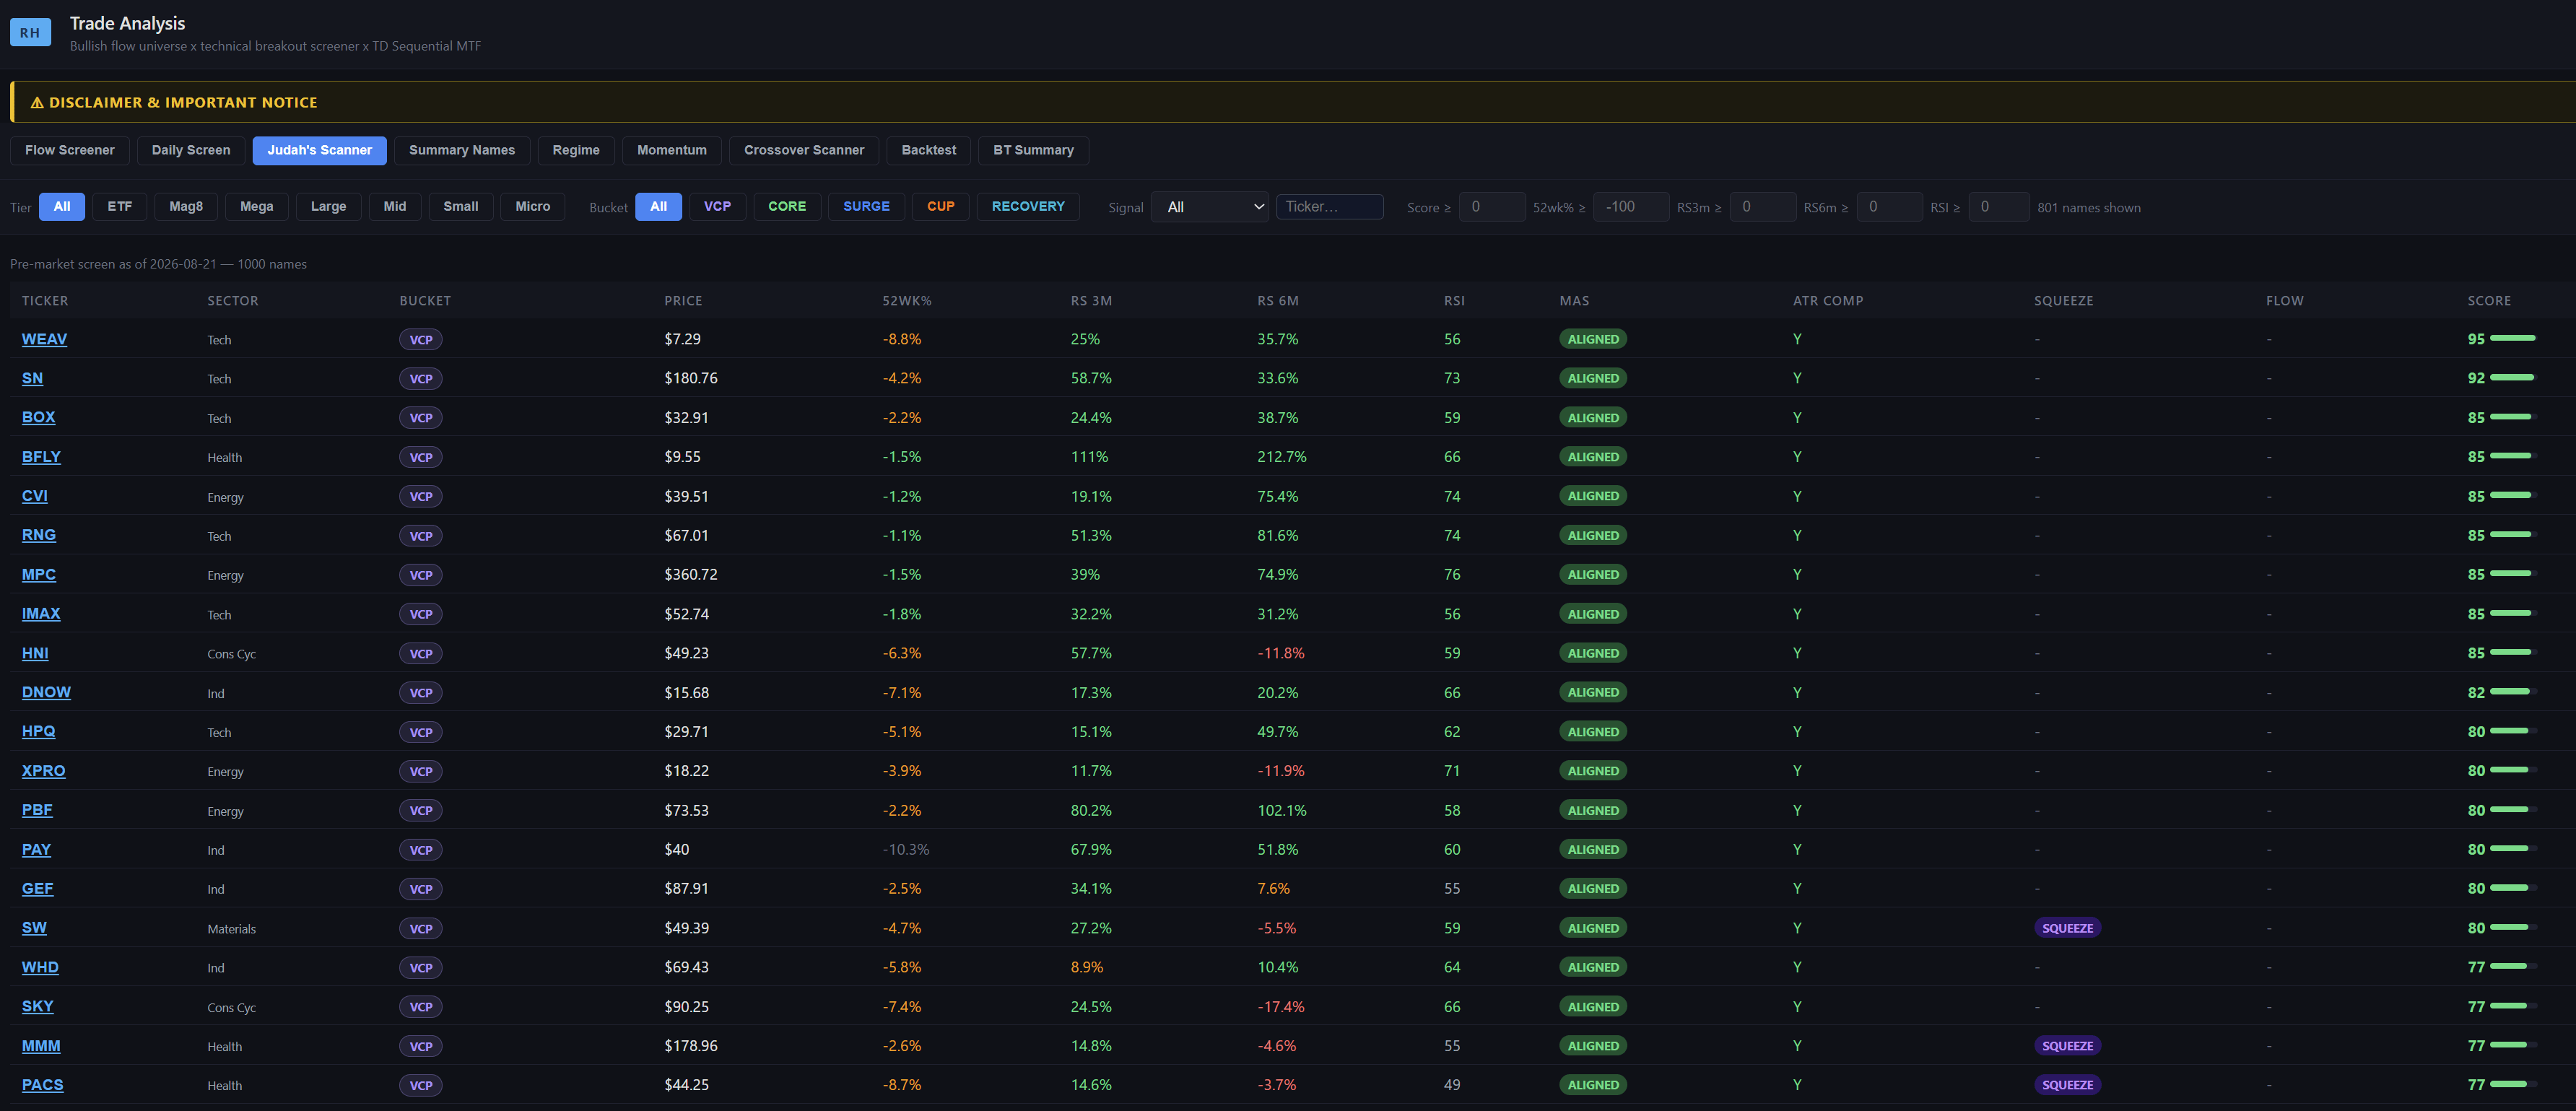
VCP - Volatility Contraction Pattern. The name is fully Stage 2 aligned, above both moving averages, within 12% of its 52-week high, and the daily range is compressing. The stock is coiling. What to look for: a breakout on volume expansion. The tighter the coil and the closer to the prior high, the cleaner the setup. Watch the descending trendline on the chart for the level to clear.
CORE - Full Stage 2 uptrend. Price is above the 50-day and 200-day moving averages, the 50-day is rising, and the name is outperforming the S&P 500 over the last three months. What to look for: pullbacks to the 21 EMA or 50-day on lower volume, with volume re-expanding on the bounce. These are the names institutional money is already in.
SURGE - Momentum breakout in progress. The move is already underway. What to look for: trailing stop management. Entry on a short consolidation or breakout extension is possible, but the easy money has often already been made. The Chandelier exit is your primary tool here.
CUP - Base building. Below the 50-day but above the 200-day, or in the process of crossing back above the 50-day. The pattern is not yet complete. What to look for: a handle forming near the top of the cup, then a breakout on volume. These require patience.
RECOVERY - Early-stage reconstruction. Above the 200-day, moving averages beginning to flatten or turn. The downtrend has ended but a new uptrend has not been confirmed. What to look for: a series of higher lows and a clean break above the 50-day on expanding volume. These are the earliest entries and carry the most risk.
The chart view:
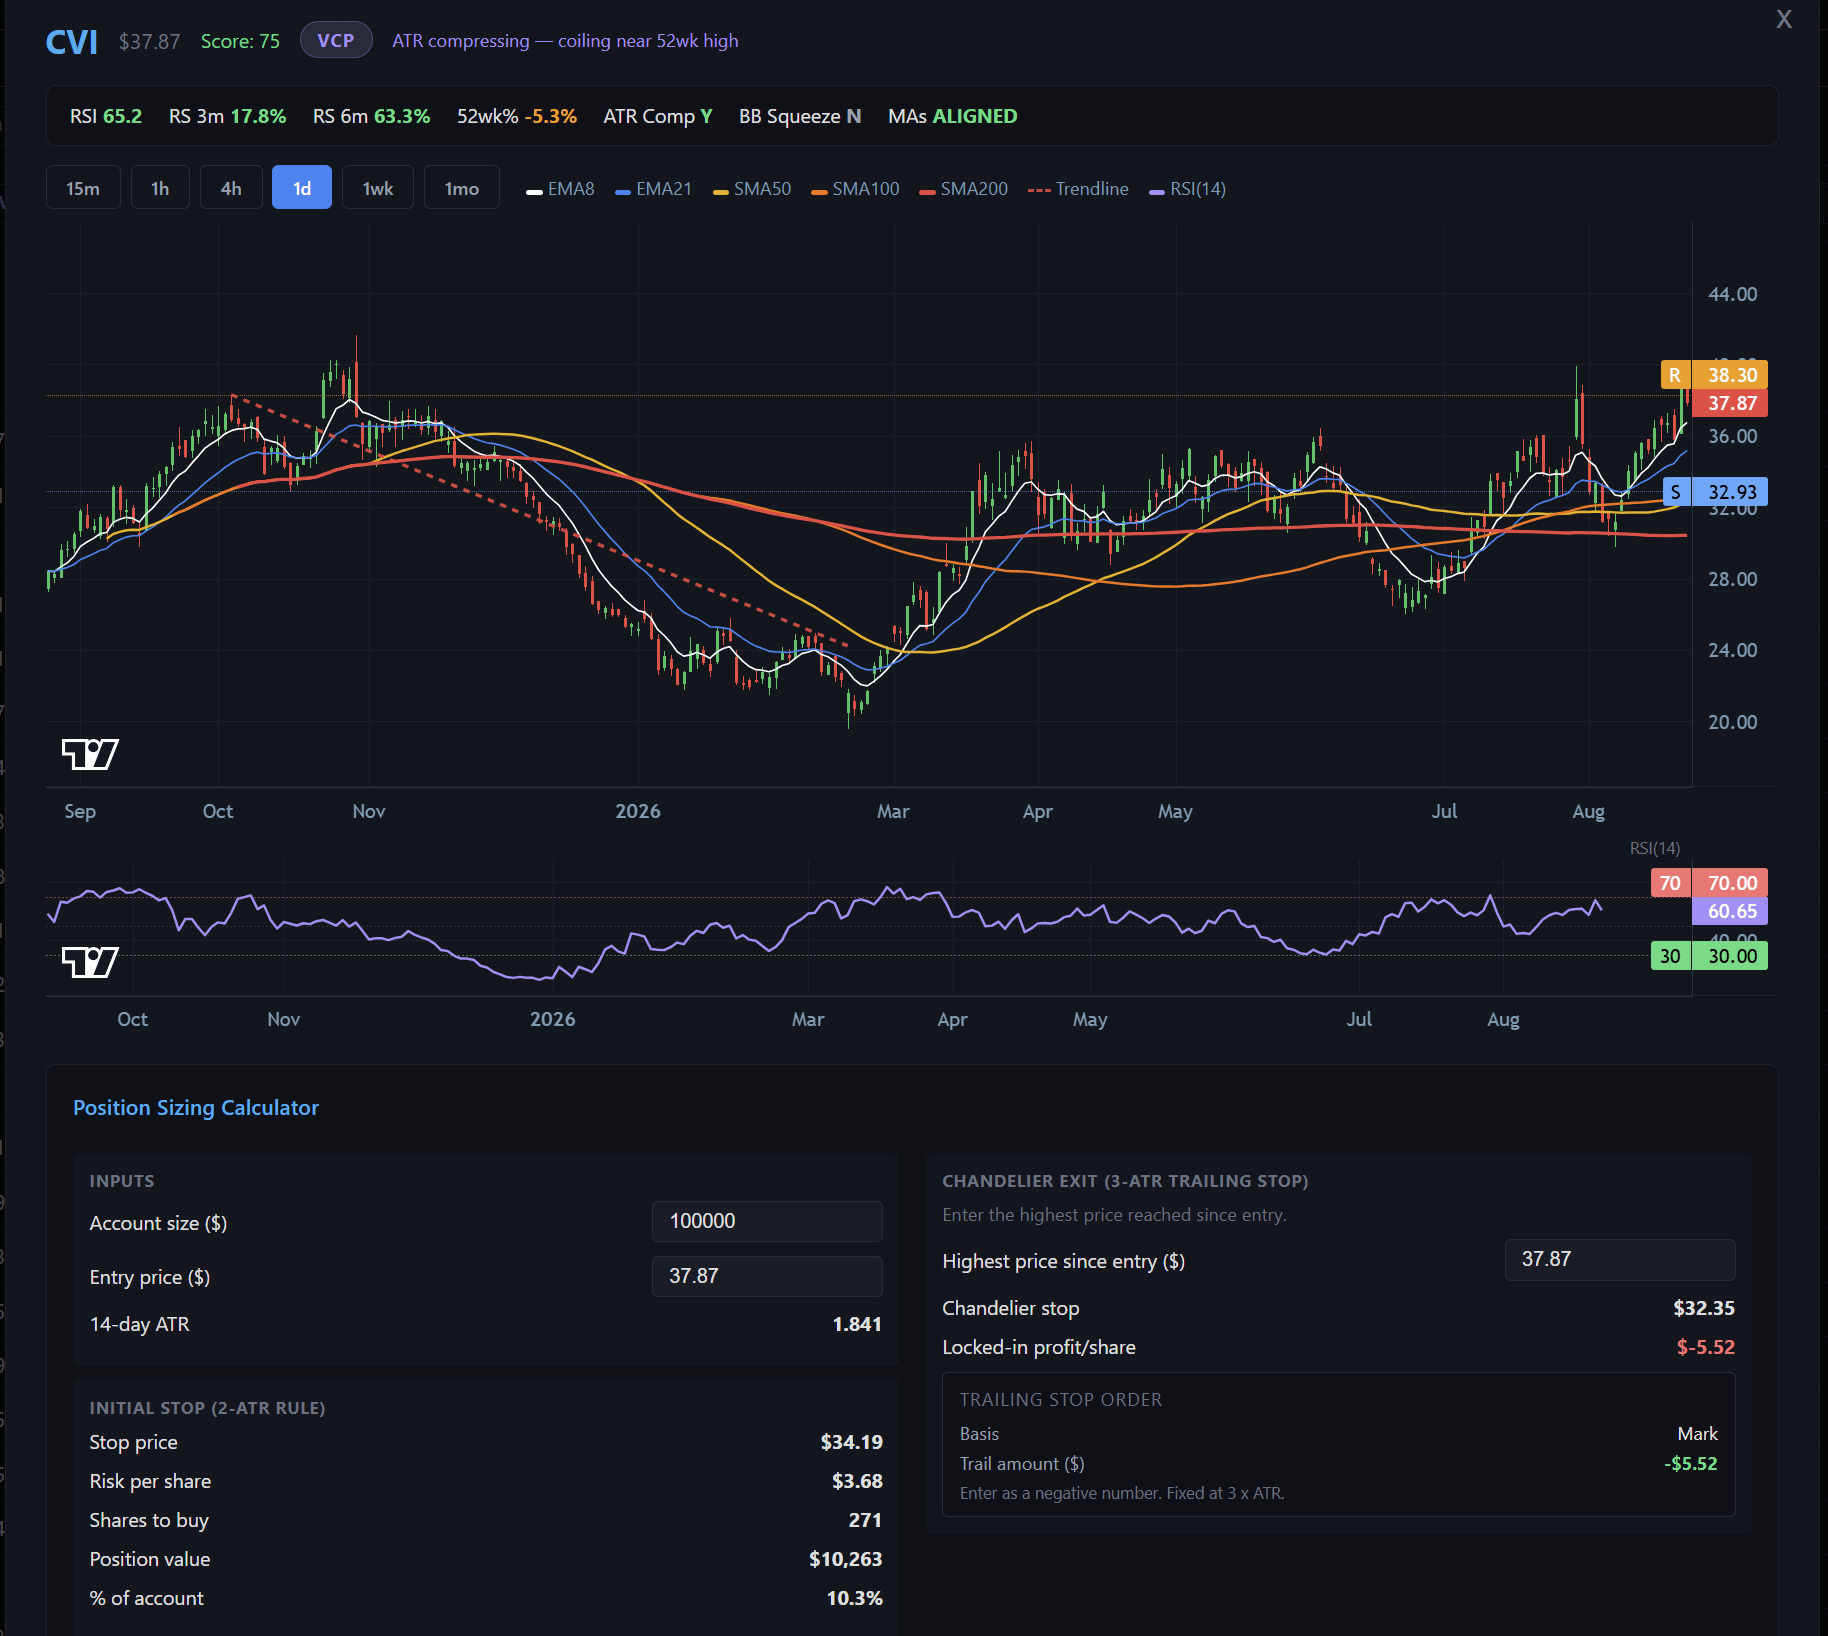
Click any ticker to open the chart. The main panel shows candlesticks with five moving averages: EMA 8, EMA 21, SMA 50, SMA 100, and SMA 200. Support and resistance levels are drawn from recent swing highs and lows. Where a clear descending resistance trendline is visible, it appears as a red dashed line. That is the level to clear on volume.
The lower panel shows RSI with reference lines at 30 and 70. Switch between 15m, 1h, 4h, daily, and weekly using the timeframe tabs. The weekly view gives you the bucket context. The daily view is best for identifying the trendline structure and planning the entry.
Momentum Scanner
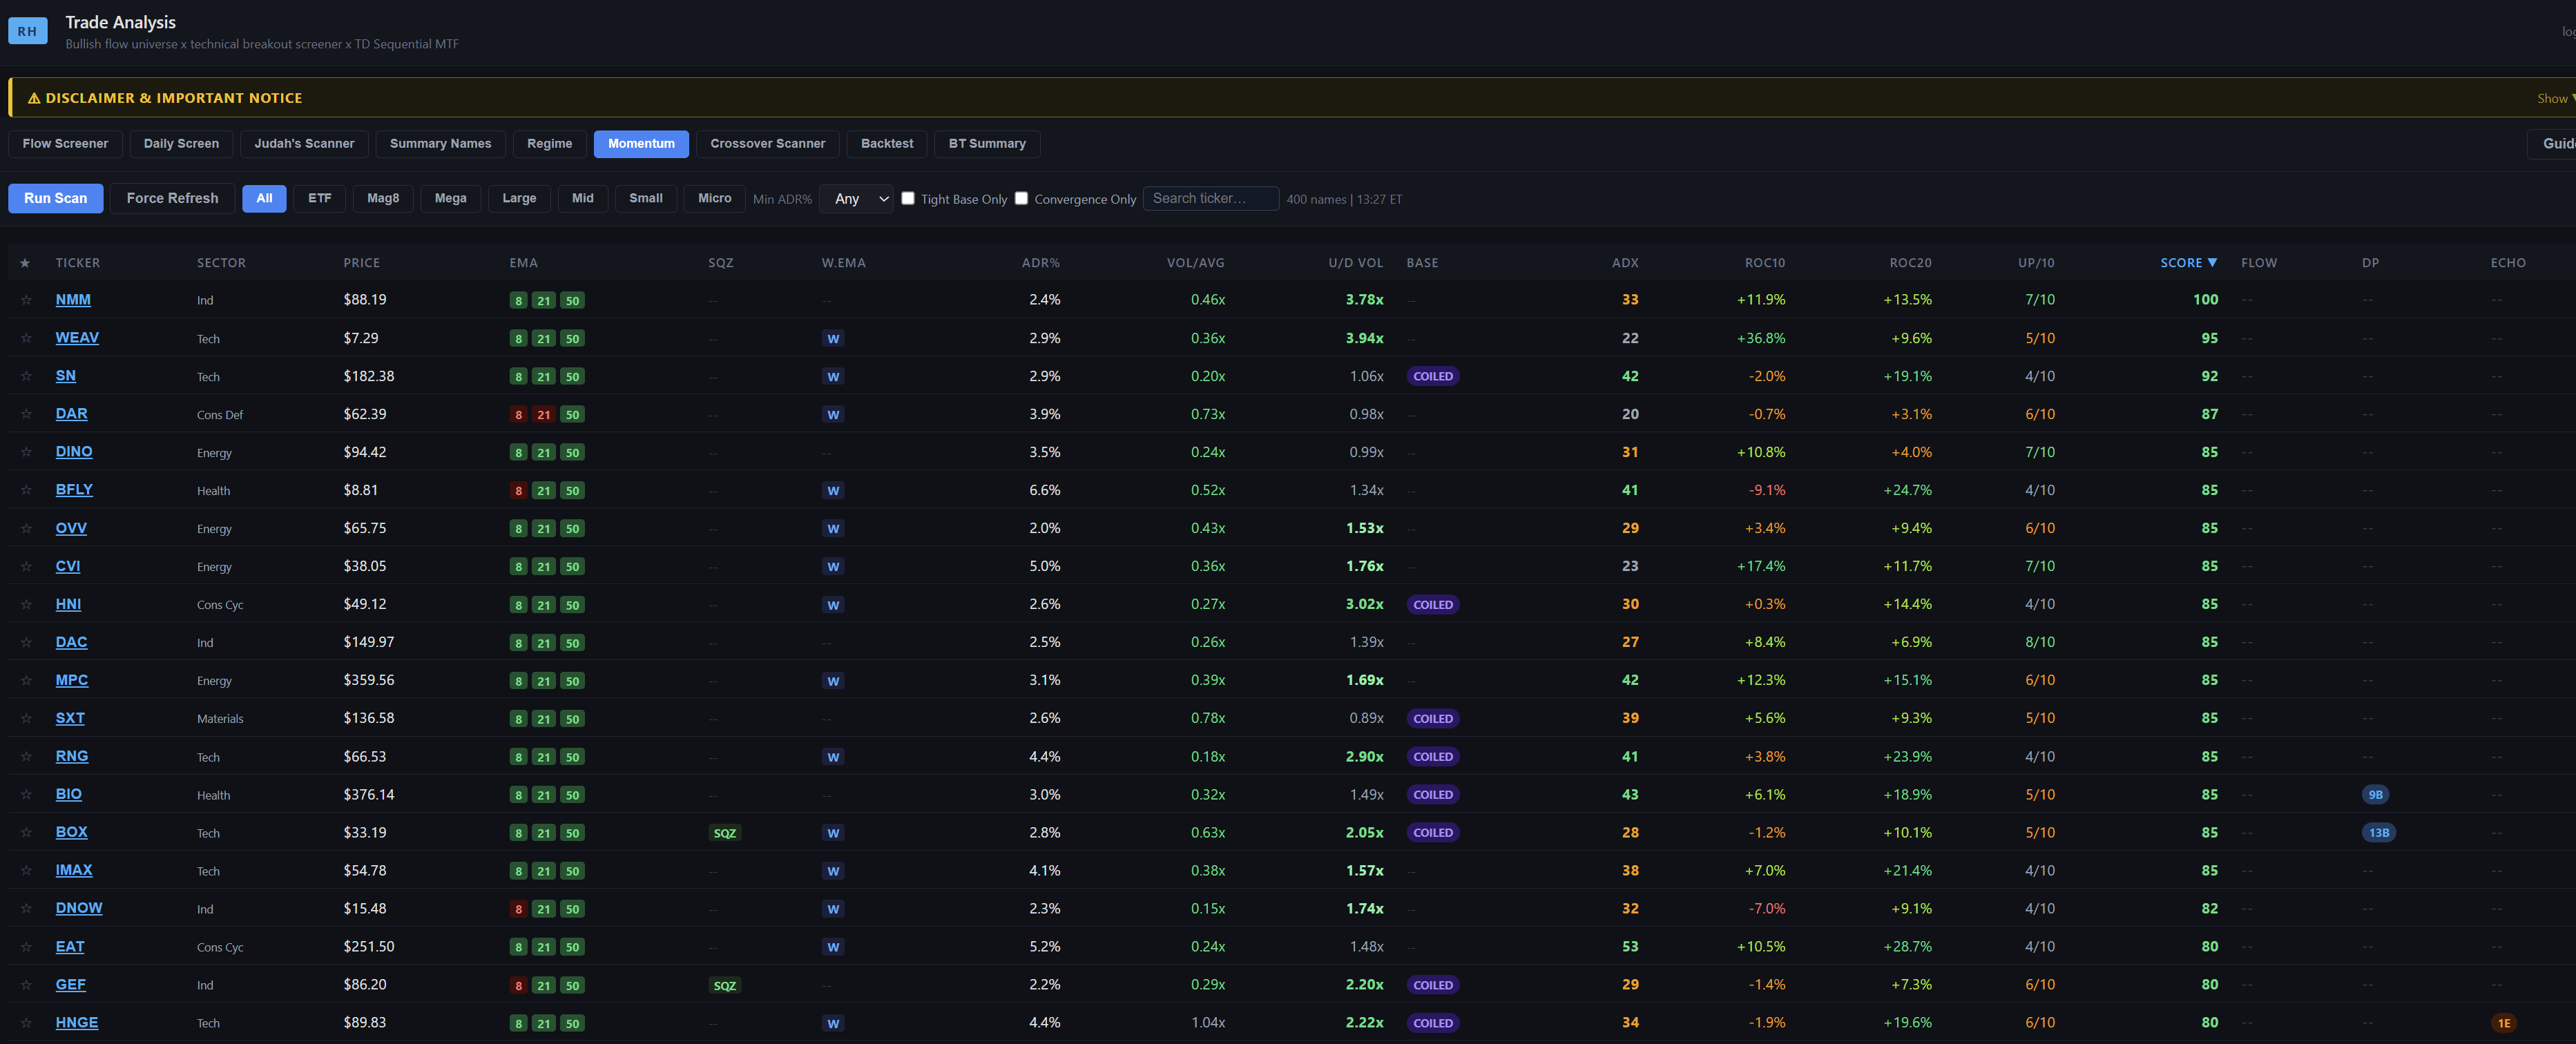
The Momentum Scanner starts with a stricter filter than the other tools. To appear in the scan, a name needs a golden cross in place (50-day above the 200-day) and needs to be trading above its 50-day moving average. That removes anything still building a base or recovering. Every name in the scan is already in an established uptrend. From there, the scanner layers in options flow, dark pool blocks, and gamma echo data on top of the technical read.
Click Run Scan to start. Results load in 30 to 60 seconds on the first run and are cached for 30 minutes after that.
Key columns:
Sqz. The TTM Squeeze condition. Bollinger Bands are sitting inside the Keltner Channel, meaning volatility is compressed. When this badge appears on a name that also has options flow or dark pool activity, it is one of the higher-conviction pre-move signals on the platform. A breakout when both indicators agree tends to be sharp.
W.EMA. Weekly EMA 8 recently crossed above weekly EMA 21. A momentum shift on the weekly chart. When the weekly and daily setups are aligned in the same direction, it is a good sign the trend has more room to run.
U/D Vol. Up/Down volume ratio over the last 20 sessions. Volume on up-day closes divided by volume on down-day closes. Above 1.5x means buyers are in control. Above 2.0x is a strong accumulation signal. A high ratio on a rising stock confirms the move is backed by real activity, not drift.
Base (COILED). The price range over the last 10 days is less than 8% of the average price, and volume over those same 10 days is declining versus the prior 20. The stock is coiling inside an established uptrend. When this appears alongside flow and dark pool activity, it is a high-quality pre-breakout signal.
Convergence
The star at the left of each row shows how many signals are aligned at once.
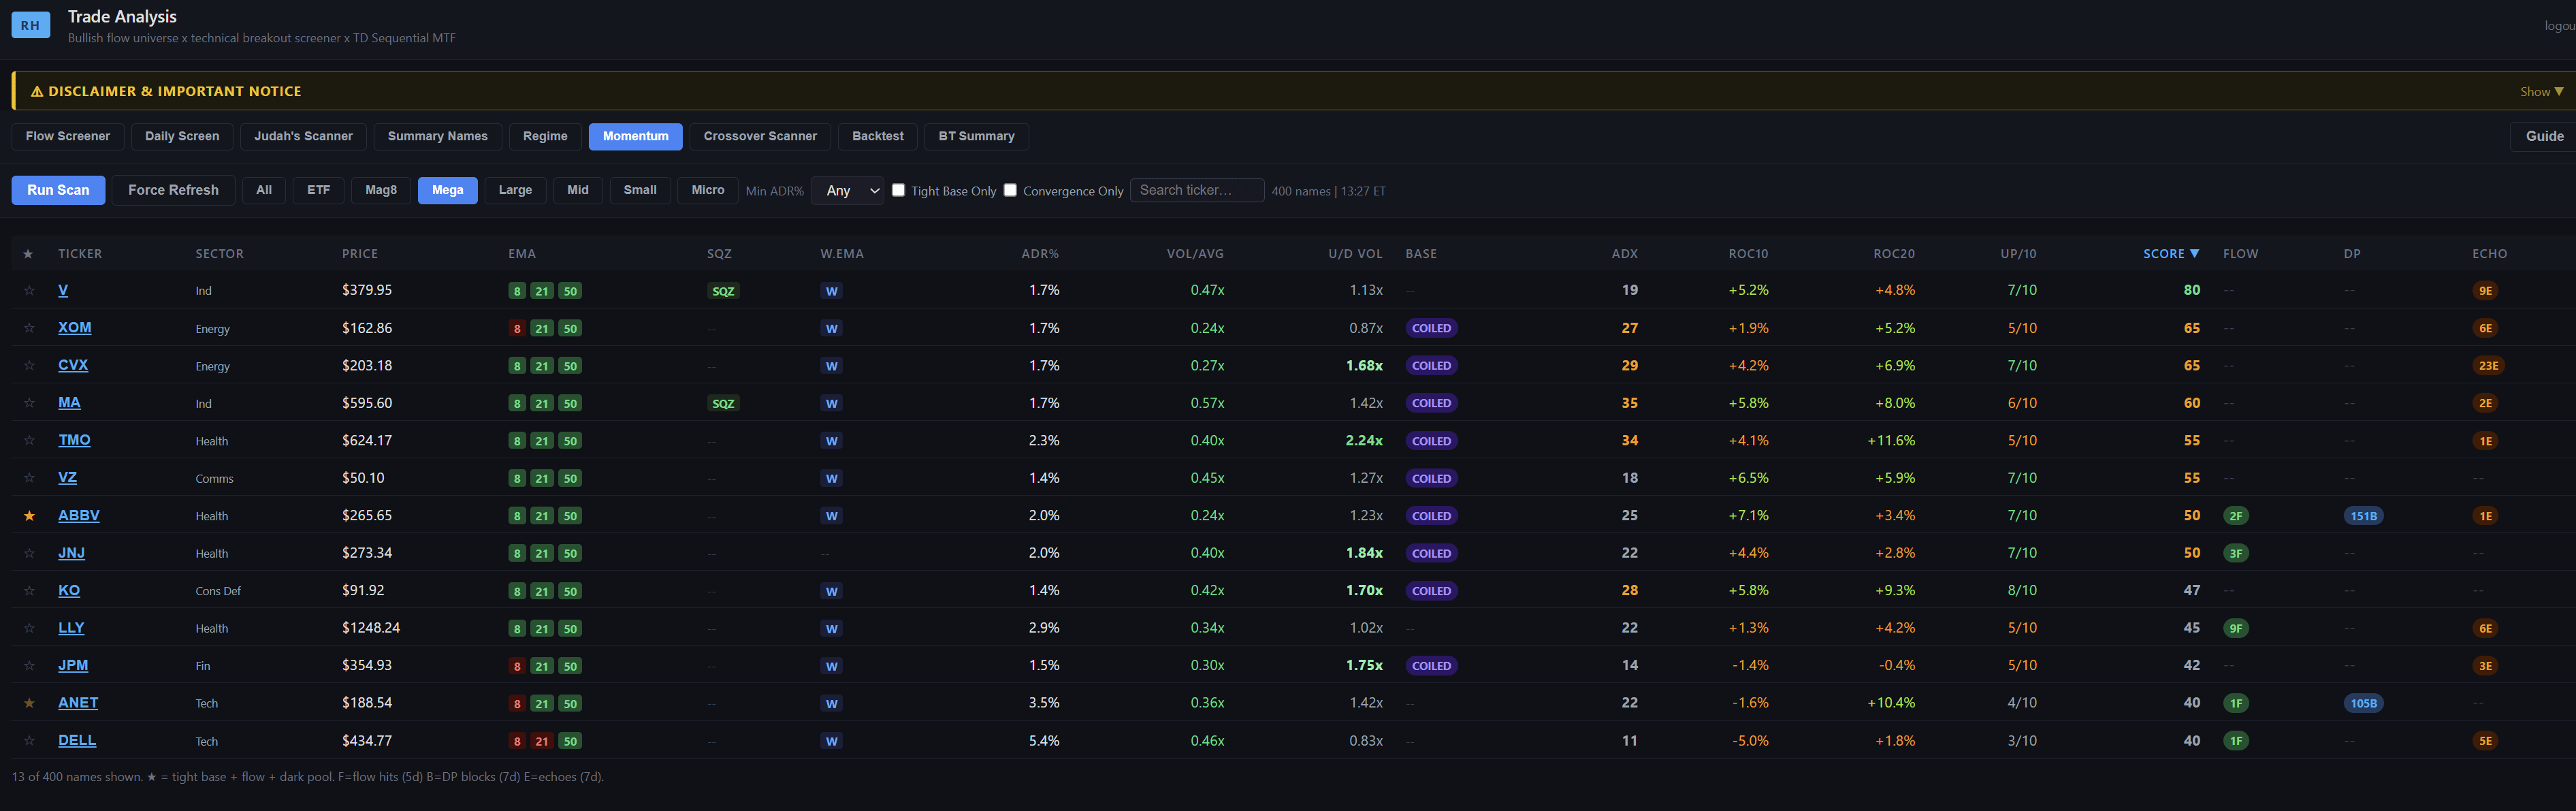
A bright gold star means full convergence: the stock is in a tight base, there is recent bullish options flow in the last five days, and there is recent dark pool block activity in the last seven days. Three independent signals pointing the same direction. These are rare. When one appears, open the detail page and check the chart for the setup.
A dim amber star means options flow and dark pool activity are both present, but there is no tight base. The stock is in an active uptrend with institutional activity confirmed across two signals. It is a meaningful setup, but without the coiling that makes the full star stand out.
Use the Convergence Only filter to surface names with either level of star. The default sort puts full convergence at the top of the list. In both these scanners u can filter by market cap tier - here is a mega cap example showing SQZ, COILED, gold star and amber star against the relevant tickers.
Both tools update pre-market each weekday. This Dashboard is available in the Institutional Grade Trading Platform