
The Dashboard

When a large, structured options trade crosses the tape it appears in the Options Intelligence Discord immediately — classified, sized, and directionally labelled. That live feed is the heartbeat of the platform. But watching a feed in real time is only part of how serious traders use flow data.
The dashboard is where the analysis happens:
A Controlled View of the Market
The dashboard takes everything that flows through the live feed and allows you to query it. Today’s flow. This week’s flow. The last month. Any date range you choose. The same filtering and classification that drives the live alerts — applied across time, so you can see not just what is happening now but what has been building.
That distinction matters. A single large print in a name is interesting. The same name appearing on the same side repeatedly over two weeks is a thesis. The dashboard is how you see the difference.
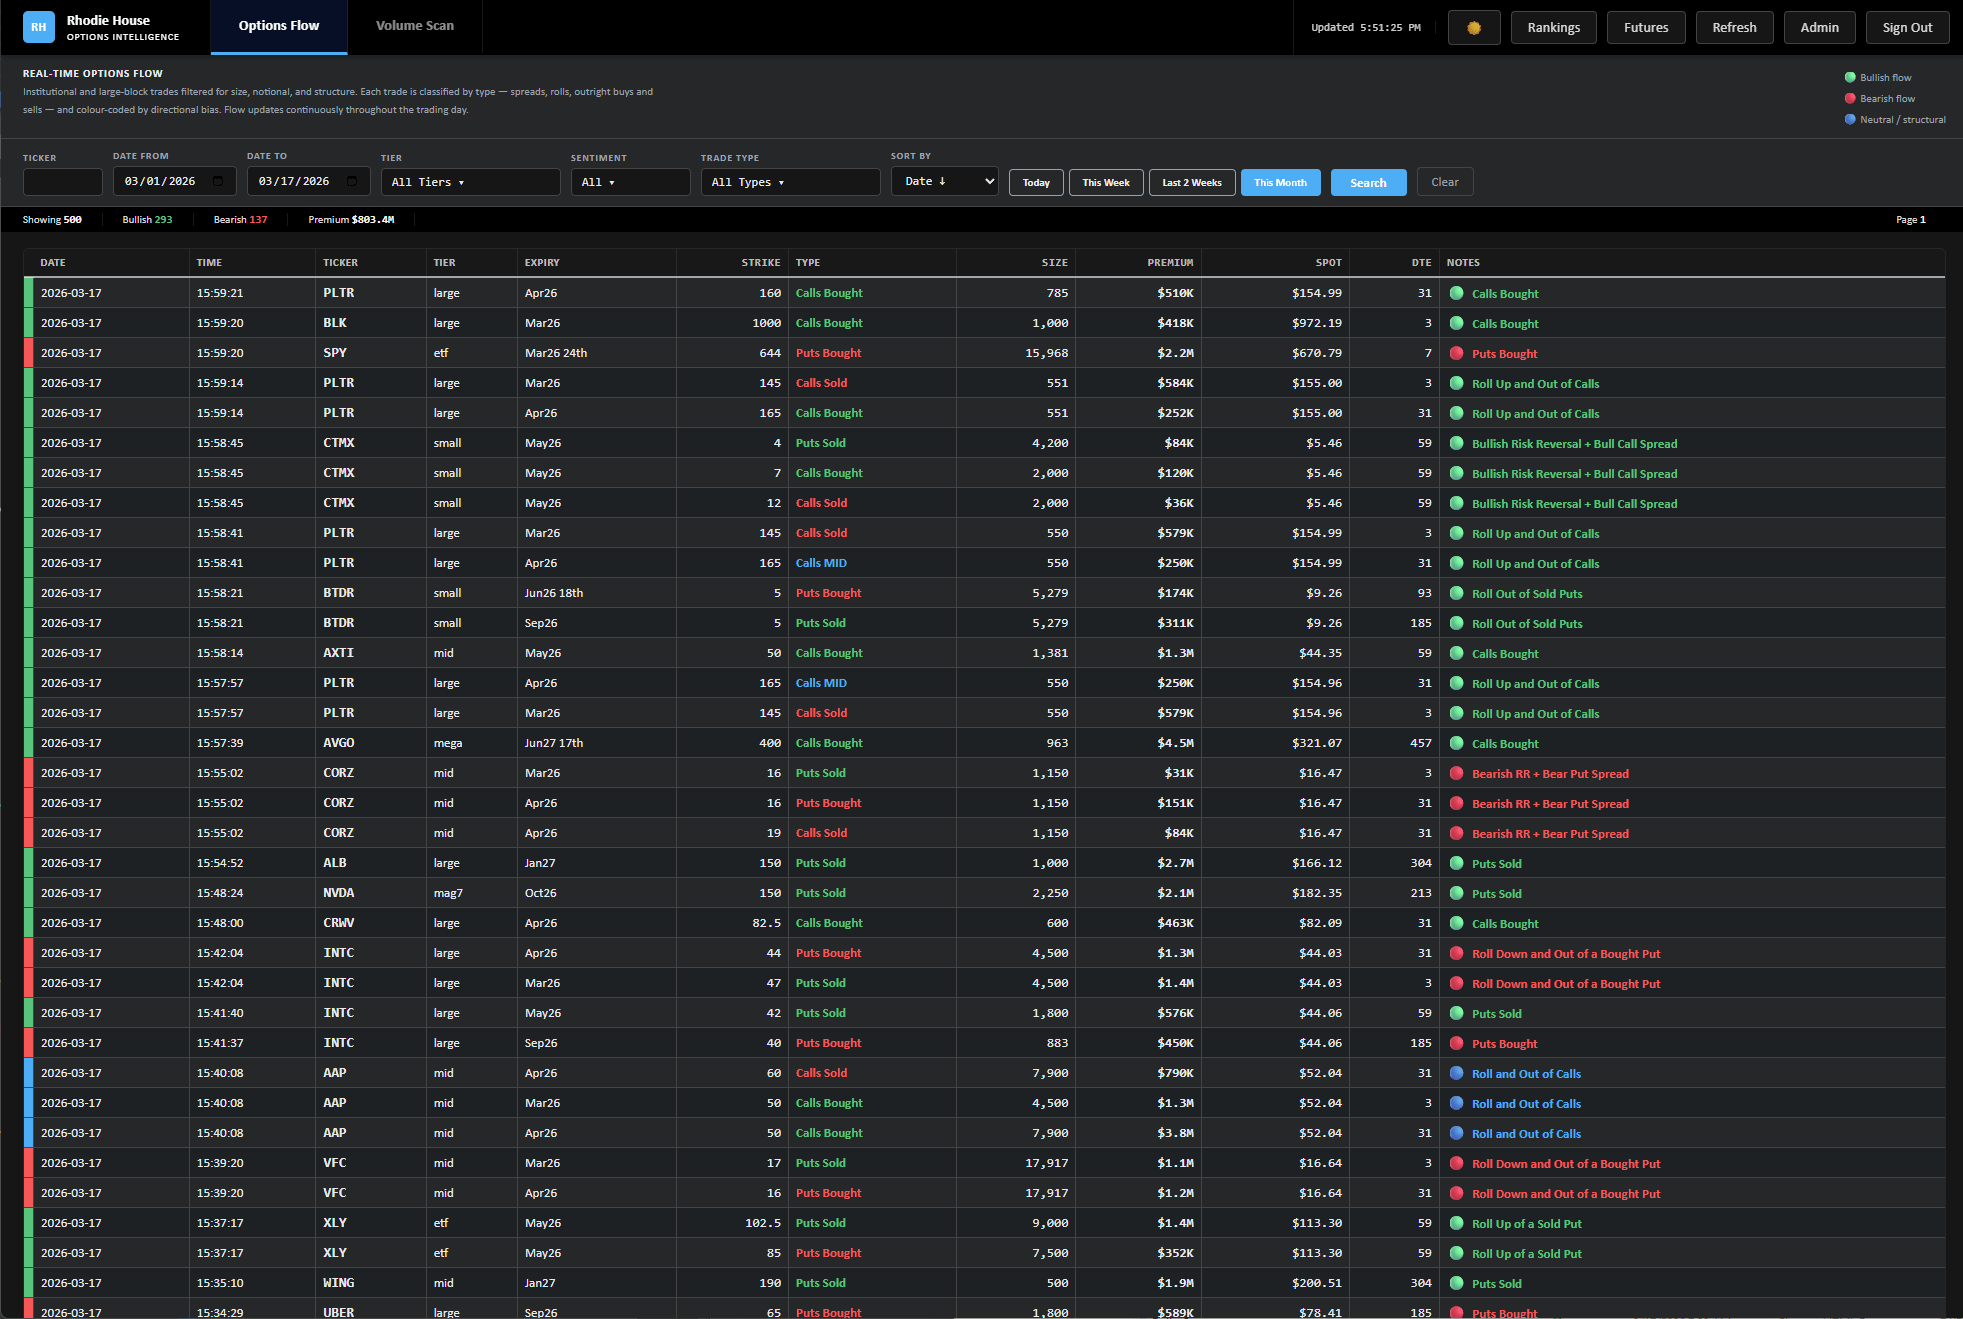
Filtering
Every trade on the dashboard has already passed a strict set of criteria — minimum notional size, price thresholds, exclusion of trades that carry no directional information. What you are looking at has been screened. The noise is gone before you see it.
From there the controls are yours. Filter by ticker, by sentiment, by trade type, by cap tier, by date range. The dashboard is designed to answer specific questions — what has been happening in semiconductors this month, where is the bearish flow concentrating, which names are seeing unusual put activity — as quickly as possible.
Classification
A call bought is not always a bullish bet. Structure matters. The dashboard classifies every trade — straight directional positions, spreads, rolls, risk reversals, multi-leg structures — so you are reading what a trade actually is, not just what it looks like on the surface. That classification is the intelligence layer.
It is also where the platform differs from both ends of a false choice that exists in this space. At one end, the manual curator — someone hand-picking prints after the fact, with all the inconsistency and survivorship bias that entails. At the other, the raw scraper — a bot pulling large trades with no understanding of what they represent.
What sits between those two is what we built. The filtering criteria — what gets in, what gets excluded, what constitutes a meaningful trade — were developed from years of experience reading institutional order flow. The classification framework that decodes raw exchange records into identifiable structures is the product of the same expertise. It runs continuously, without bias, from market open to close. The result is a feed that combines the consistency of a systematic process with the judgement of practitioners who know what they are looking at.
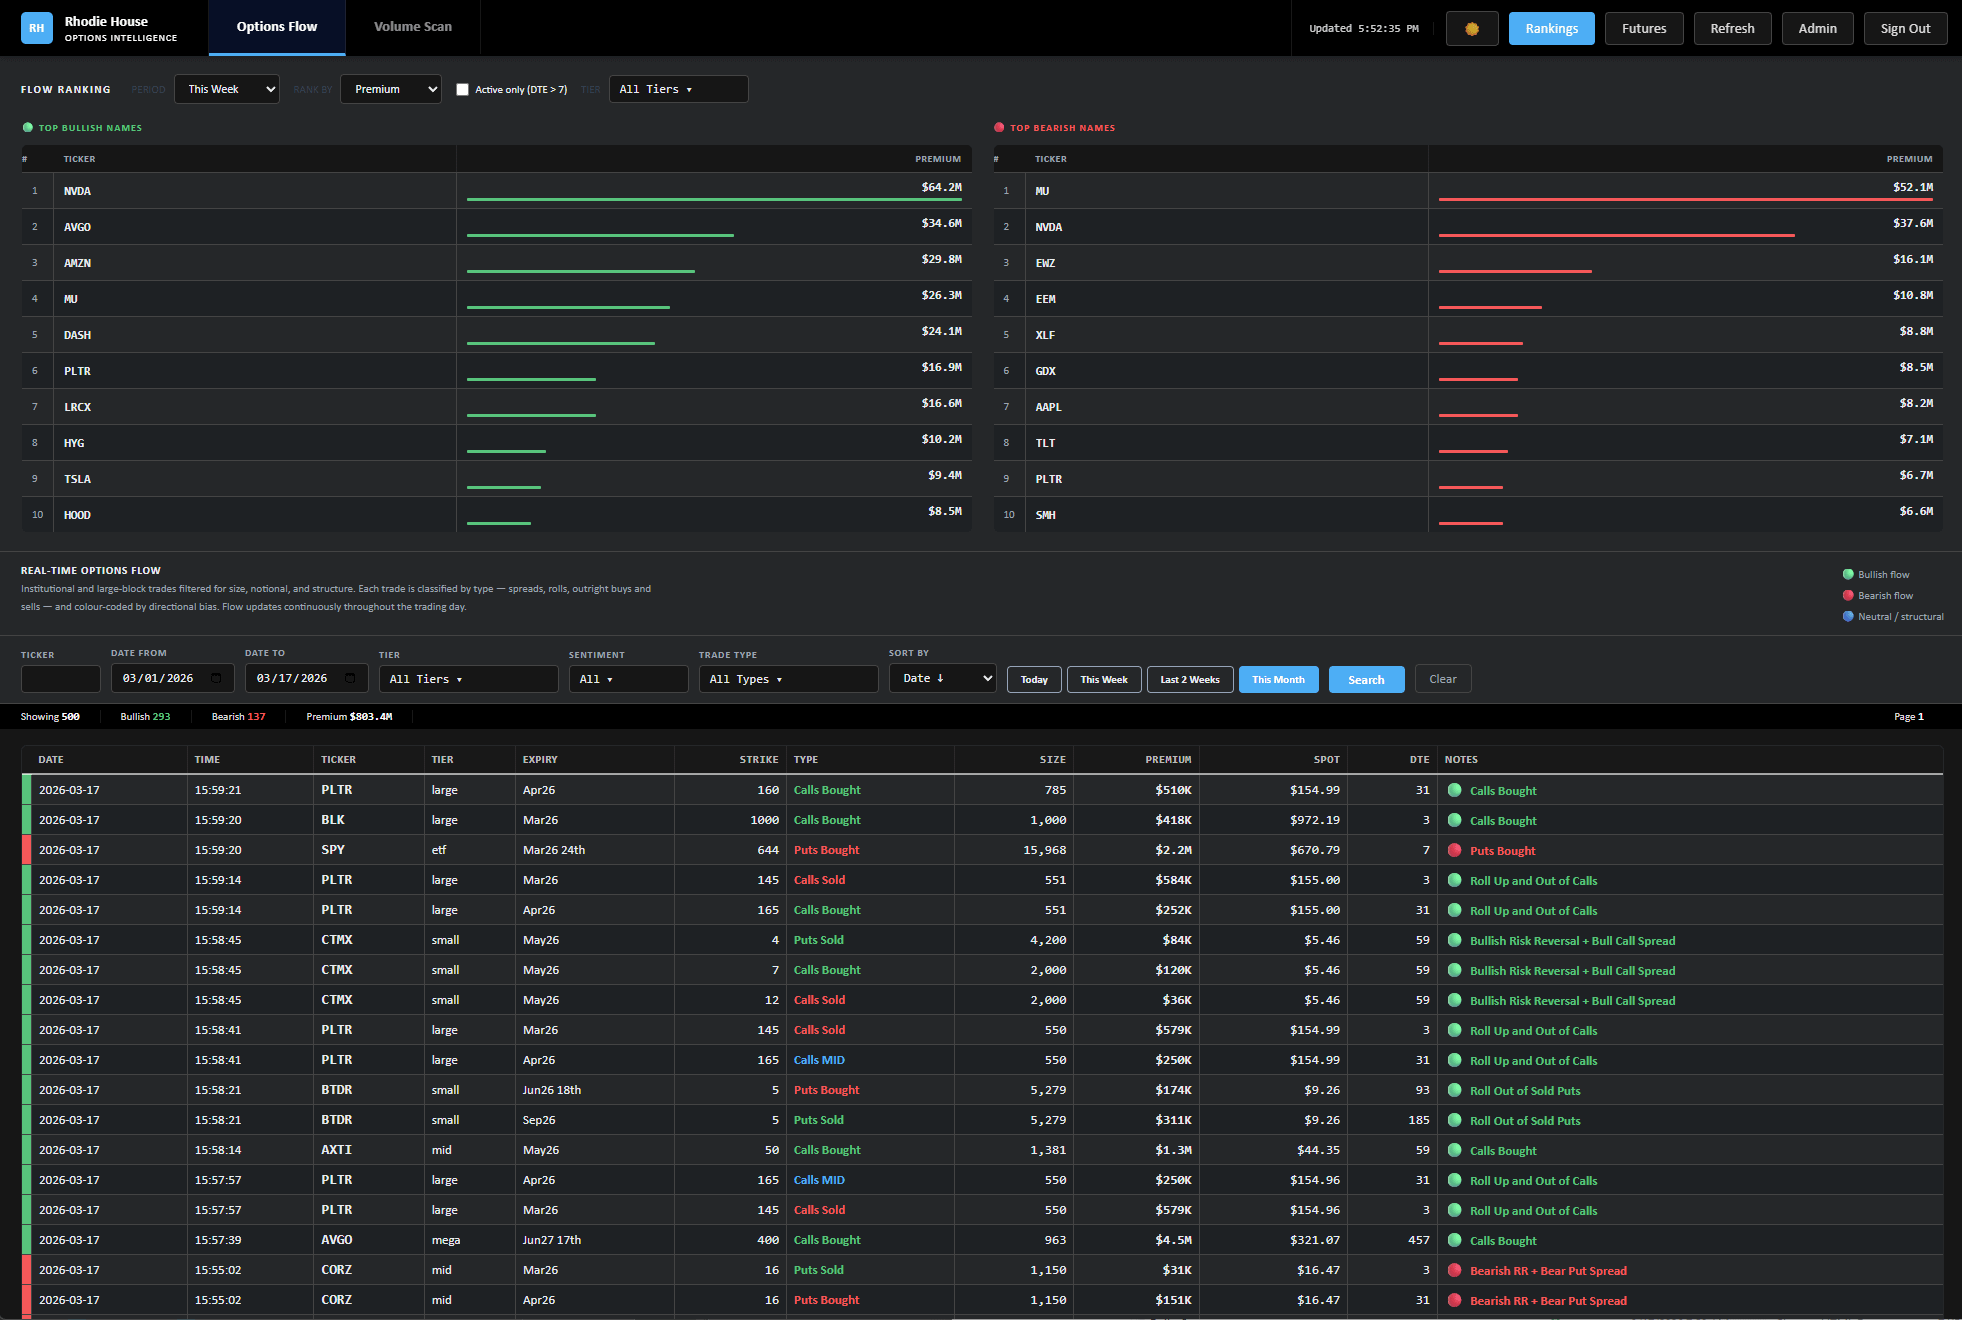
Flow Rankings
The ranking panel aggregates flow by ticker over any period and shows where conviction is building. Bullish flow by notional. Bearish flow by count. The names appearing repeatedly on the same side. You are not just seeing individual prints — you are seeing the weight of money moving in a direction over time.
Volume Scan
Alongside the flow dashboard sits the volume scan — a real-time screen across the equity market showing stocks and sector ETFs with abnormal volume activity relative to their 10-day average at the same point in the trading day.
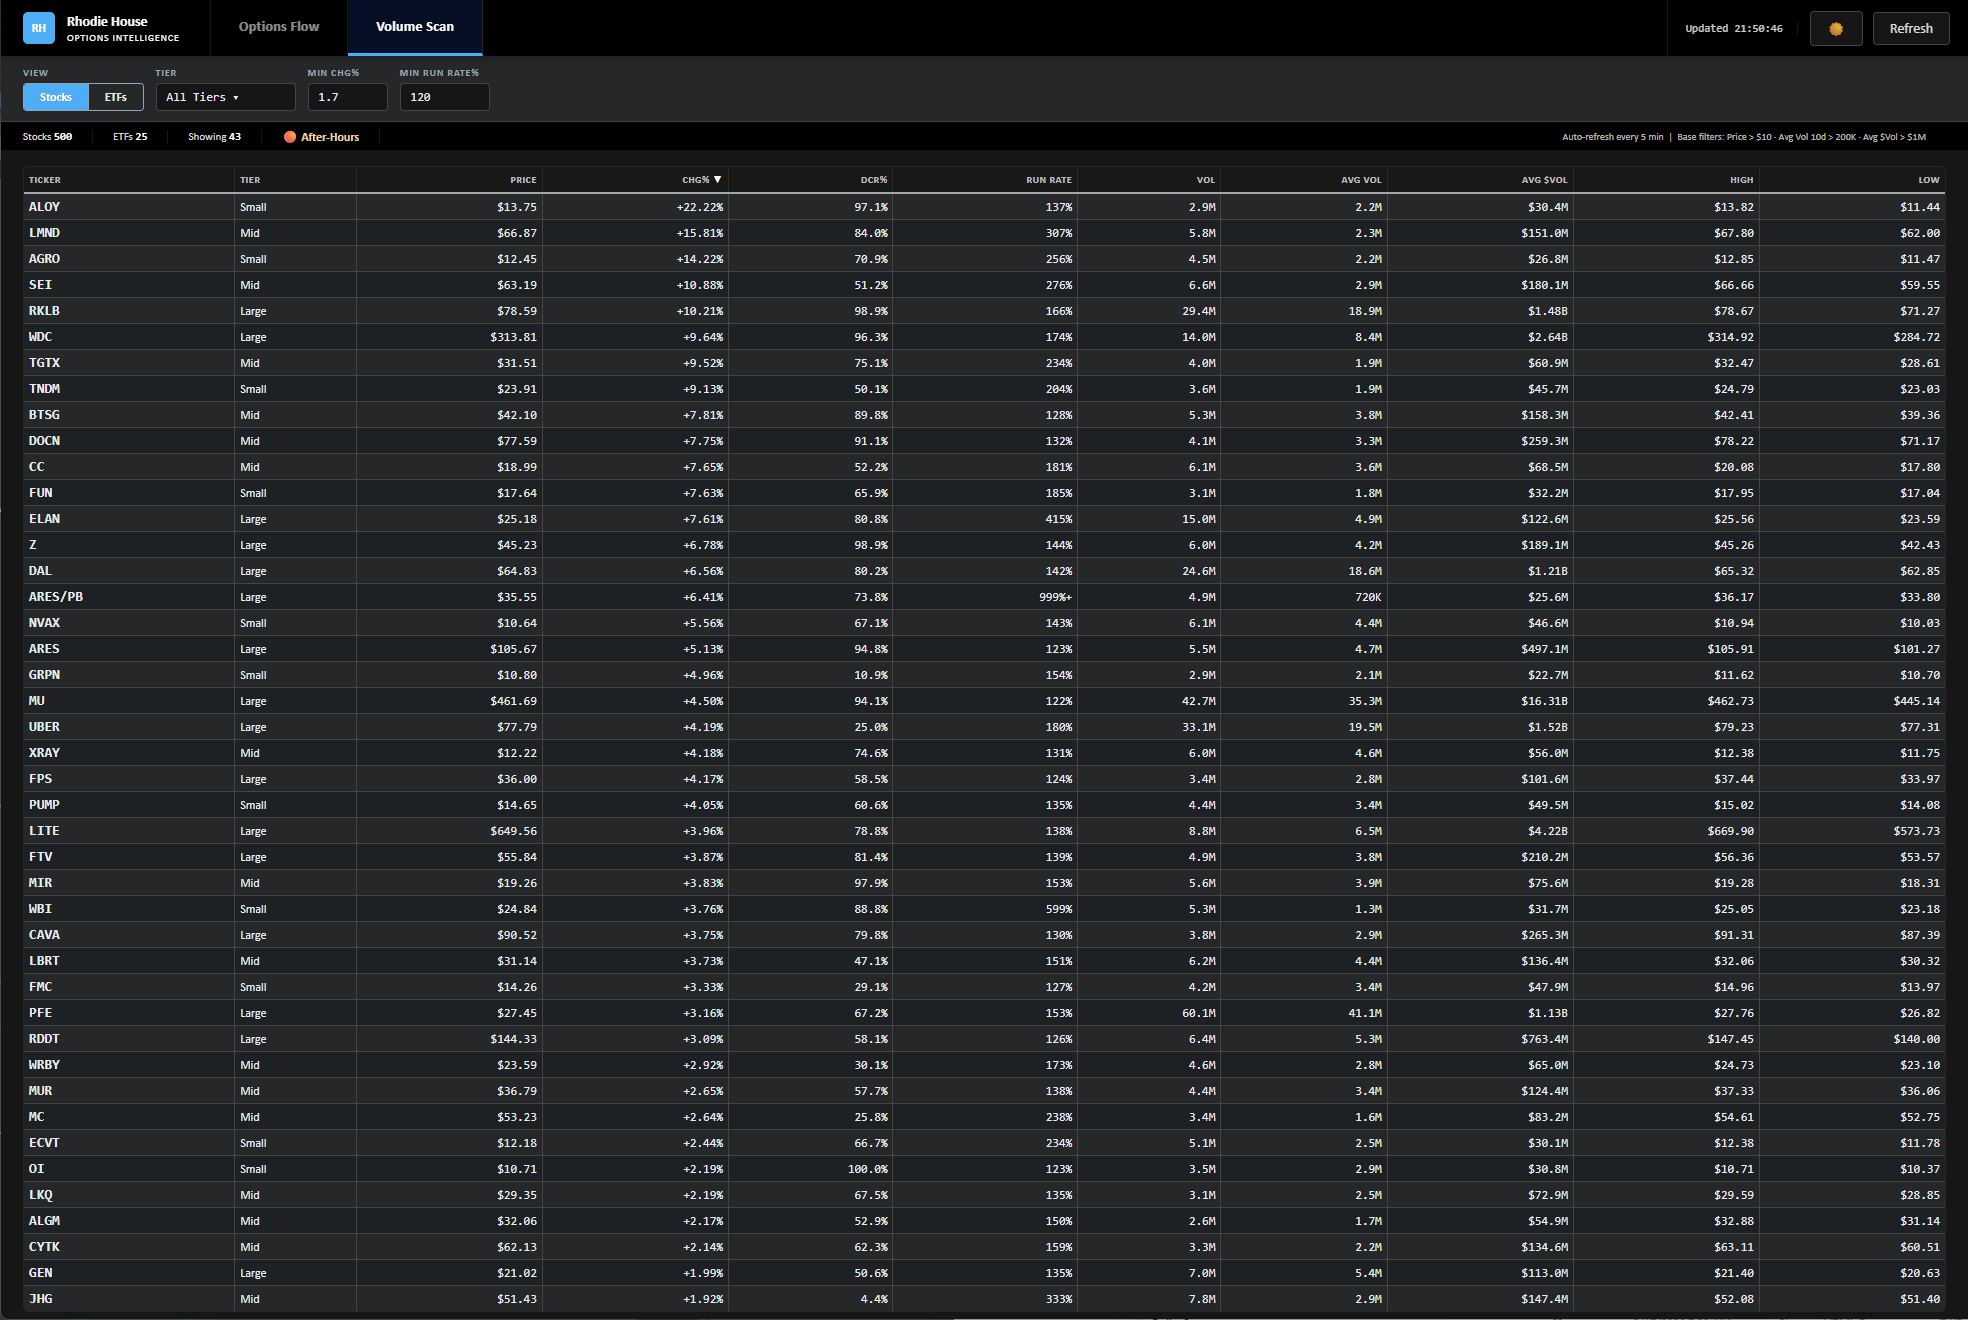
Options flow tells you where informed money is positioning. Volume tells you where the market is waking up. A stock pressing the top of its intraday range on twice its normal volume at 10am is worth a look at the flow dashboard. When both are pointing the same direction you have confluence — and that is when it gets interesting.
The volume scan covers individual stocks by cap tier and a curated list of sector ETFs — energy, financials, technology, healthcare, semiconductors, precious metals and others. Sector rotation shows up in ETF volume before it shows up in individual names.
What It Is Not
The dashboard does not generate signals or tell you what to trade. It gives you the same data the largest participants in the options market are generating — organized, classified, and searchable — and leaves the judgement entirely to you.
That is intentional. The traders this platform is built for do not need to be told what to do. They need better information to make their own decisions.
I'm 62 need that on a 40 inch screen in 30 pt font!!!!