

Gamma exposure has become one of the most widely discussed ideas in options trading. It is also one of the most frequently oversimplified.
A green bar is not automatically bullish. A red bar is not automatically bearish. A gamma wall is not guaranteed support or resistance. And a gamma flip is not a trade signal.
Used properly, GEX answers a different and more useful question: if price starts moving, is the options structure more likely to absorb that move or reinforce it?

Delta Is the Hedge. Gamma Changes the Hedge.
Delta estimates how much an option’s value changes when the underlying moves. Gamma estimates how much that delta changes as the underlying moves again.
Dealers managing options positions may trade stock or futures to control their directional exposure. When option delta changes, the hedge may need to change with it. If the options book is large enough, that rebalancing can become relevant to the underlying market.
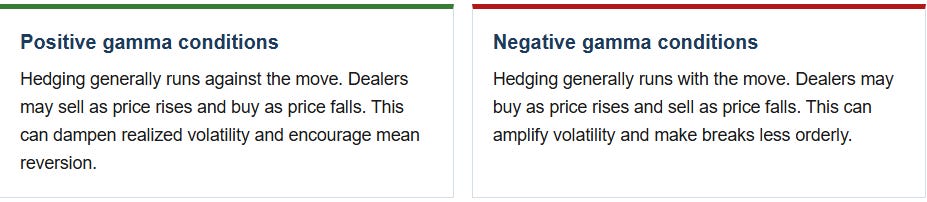
Neither condition predicts direction. A market can rise in positive gamma and fall in negative gamma. The regime describes the potential character of the move, not its destination.
The Most Important Limitation
Open interest tells us how many option contracts remain active. It does not reveal the complete inventory of customers and dealers, nor does it reveal every stock or futures hedge attached to those contracts.
That means any GEX dashboard is working with assumptions. In particular, the positive or negative GEX sign depends on which side of the options inventory the model assumes dealers hold. Reverse that assumed inventory and the estimated sign can reverse as well. The responsible way to present GEX is as an estimate of market structure, not as a direct observation of what every dealer owns.

How I Read the Rhodie House Gamma Dashboard
I do not begin by looking for the largest bar. I begin with the regime.
1. Is the market stabilizing, reactive, or in transition?
The first question is whether spot sits in a more stabilizing area, a more reactive area, or between the longer structural picture and the same-day picture.
That transition state matters. When different time horizons disagree, the right response is not to force a confident answer. It is to reduce confidence and wait for price to establish which side is controlling the session.
2. Where is the nearest meaningful concentration?
Next, I identify the most relevant call-side and put-side concentrations around spot. I also note the largest overall gamma node and any larger structural levels farther away.
Distance matters. A very large node several percent away may be less relevant to the next hour than a smaller concentration sitting directly beside price.
3. Which expiration creates the level?
An aggregate profile tells us where exposure is concentrated. The expiration view tells us what is creating it.
A level dominated by options expiring today can change quickly as price, implied volatility, and time change. A level supported across several expirations may be more persistent. Two tickers can display similar total GEX while carrying very different structures underneath.
4. Does the same-day activity agree?
Structural open interest is yesterday’s settled backdrop. Same-day flow is today’s activity. The two layers can reinforce one another, conflict, or provide no useful confirmation at all.
Keeping those layers separate is critical. Intraday flow does not instantly rewrite settled open interest, and settled open interest does not capture every position opened today.
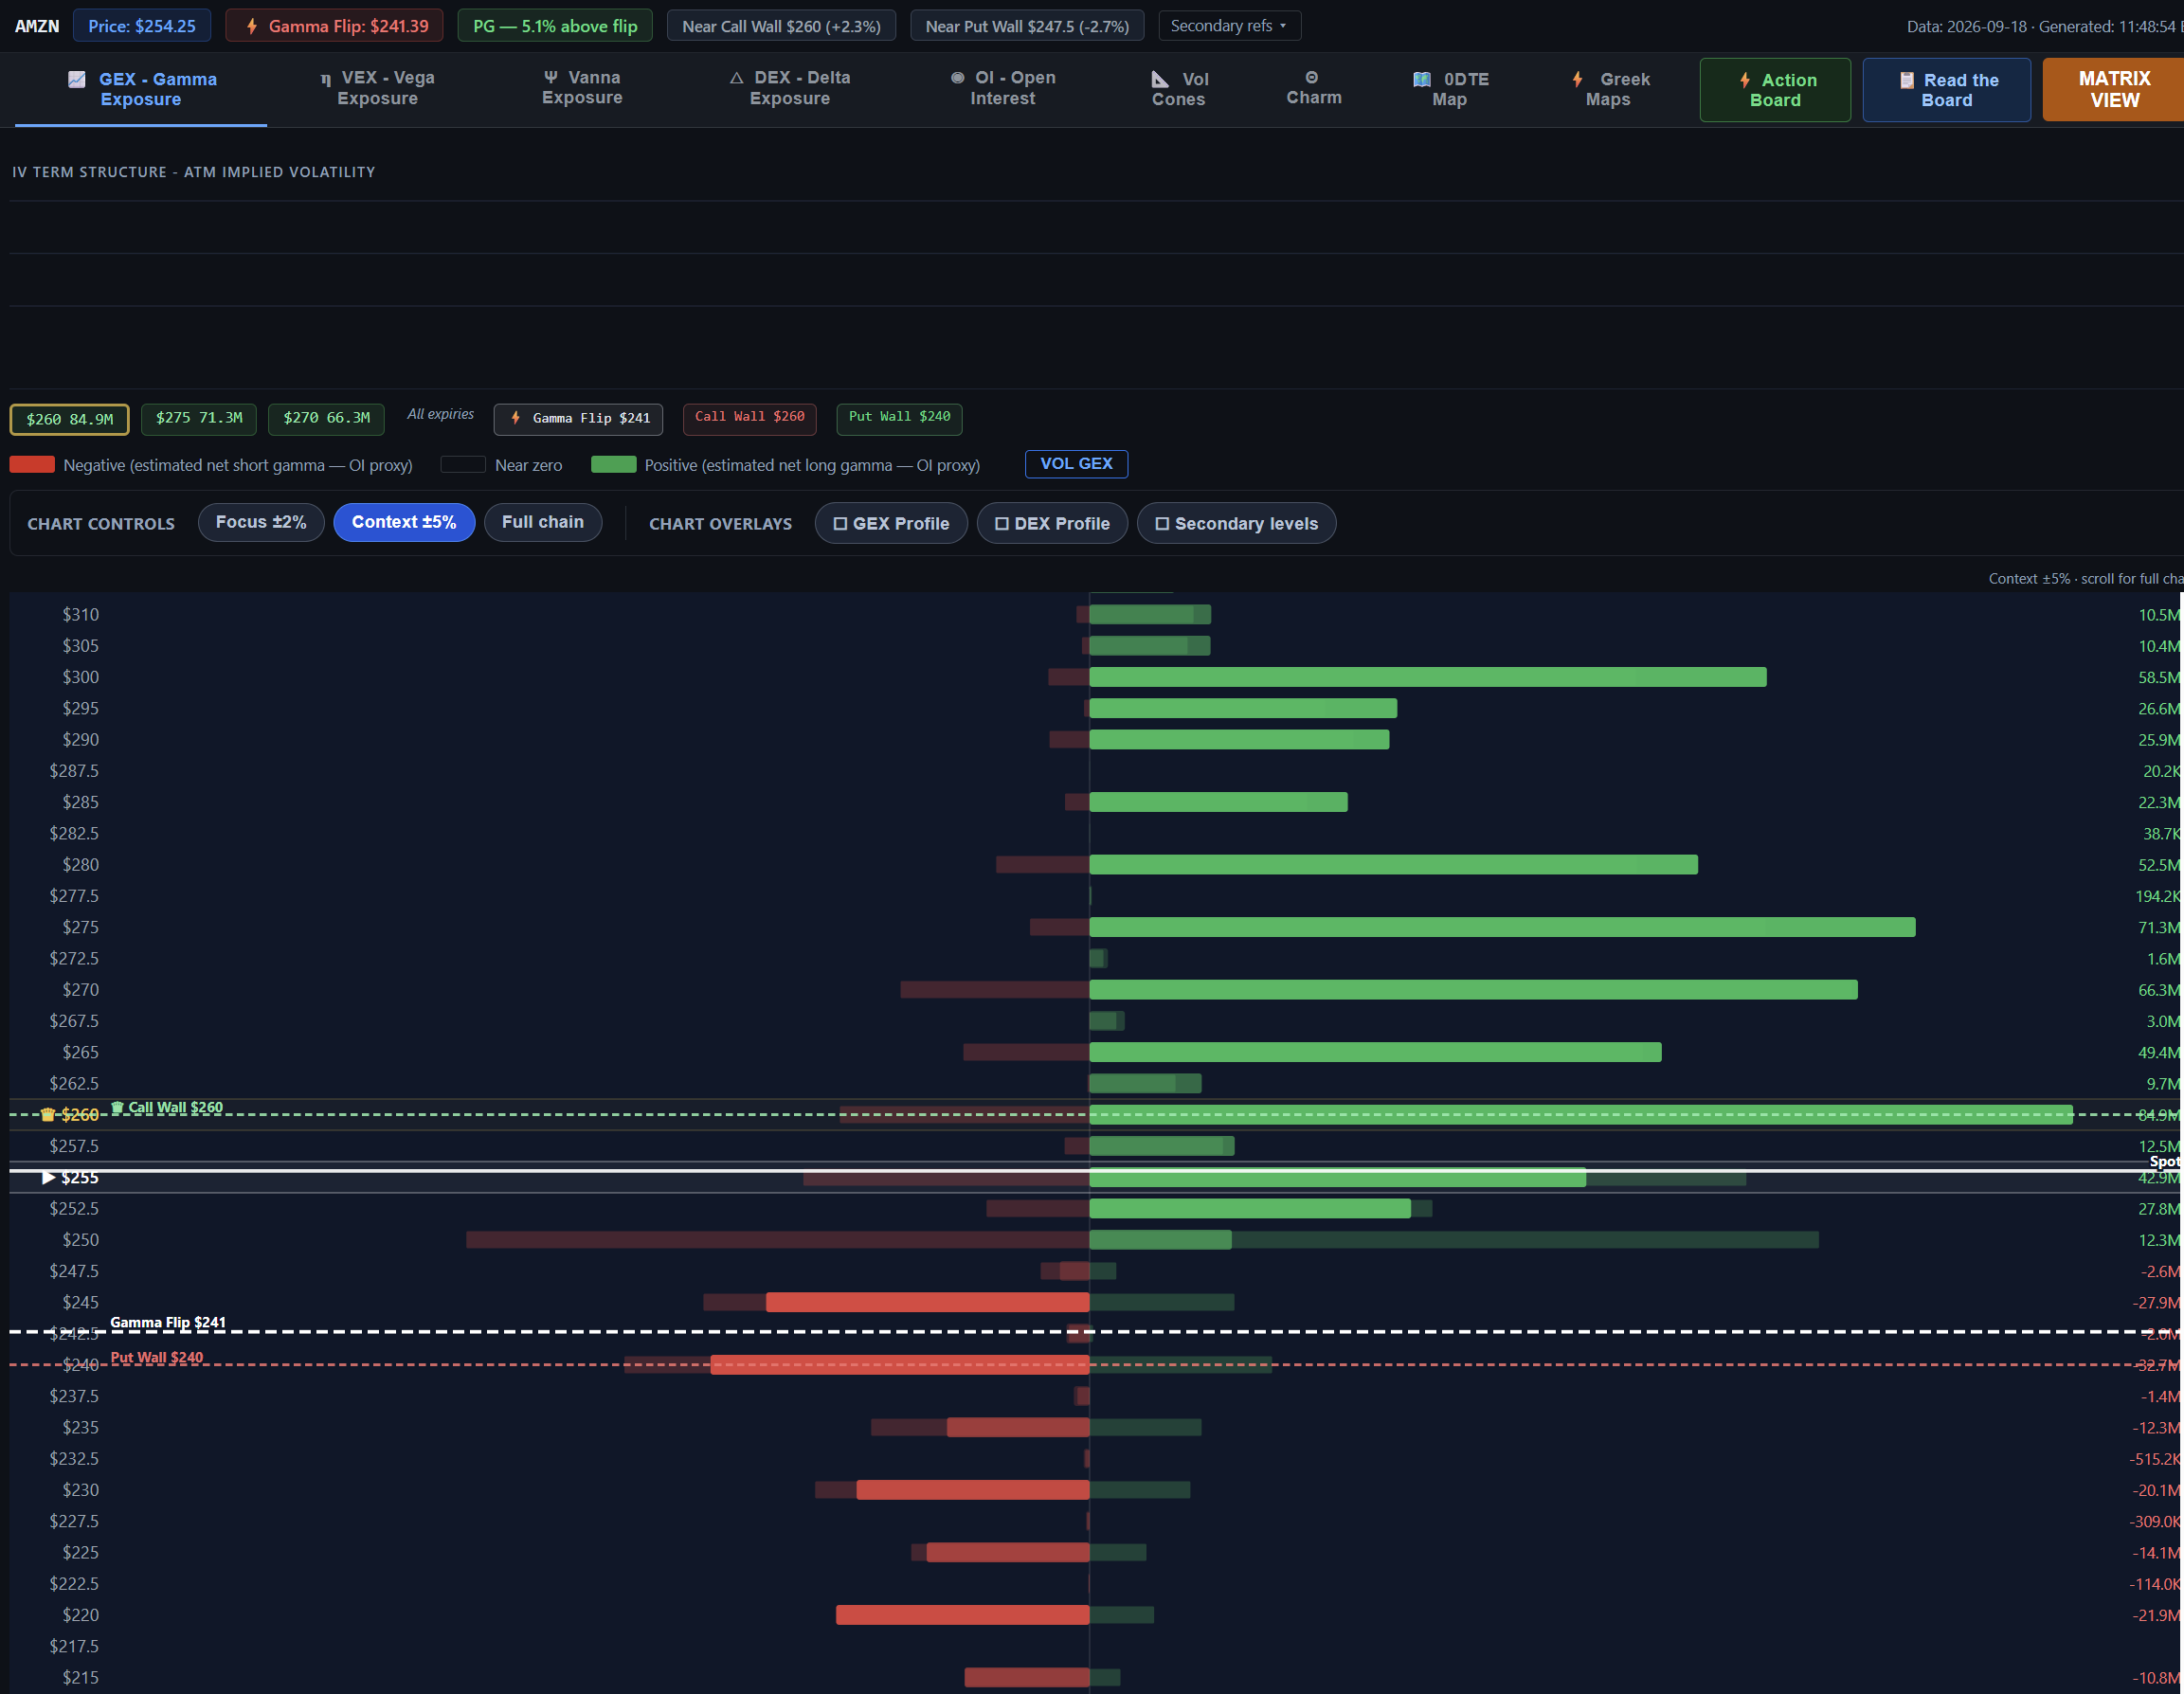
A Real-World AMZN Board Read
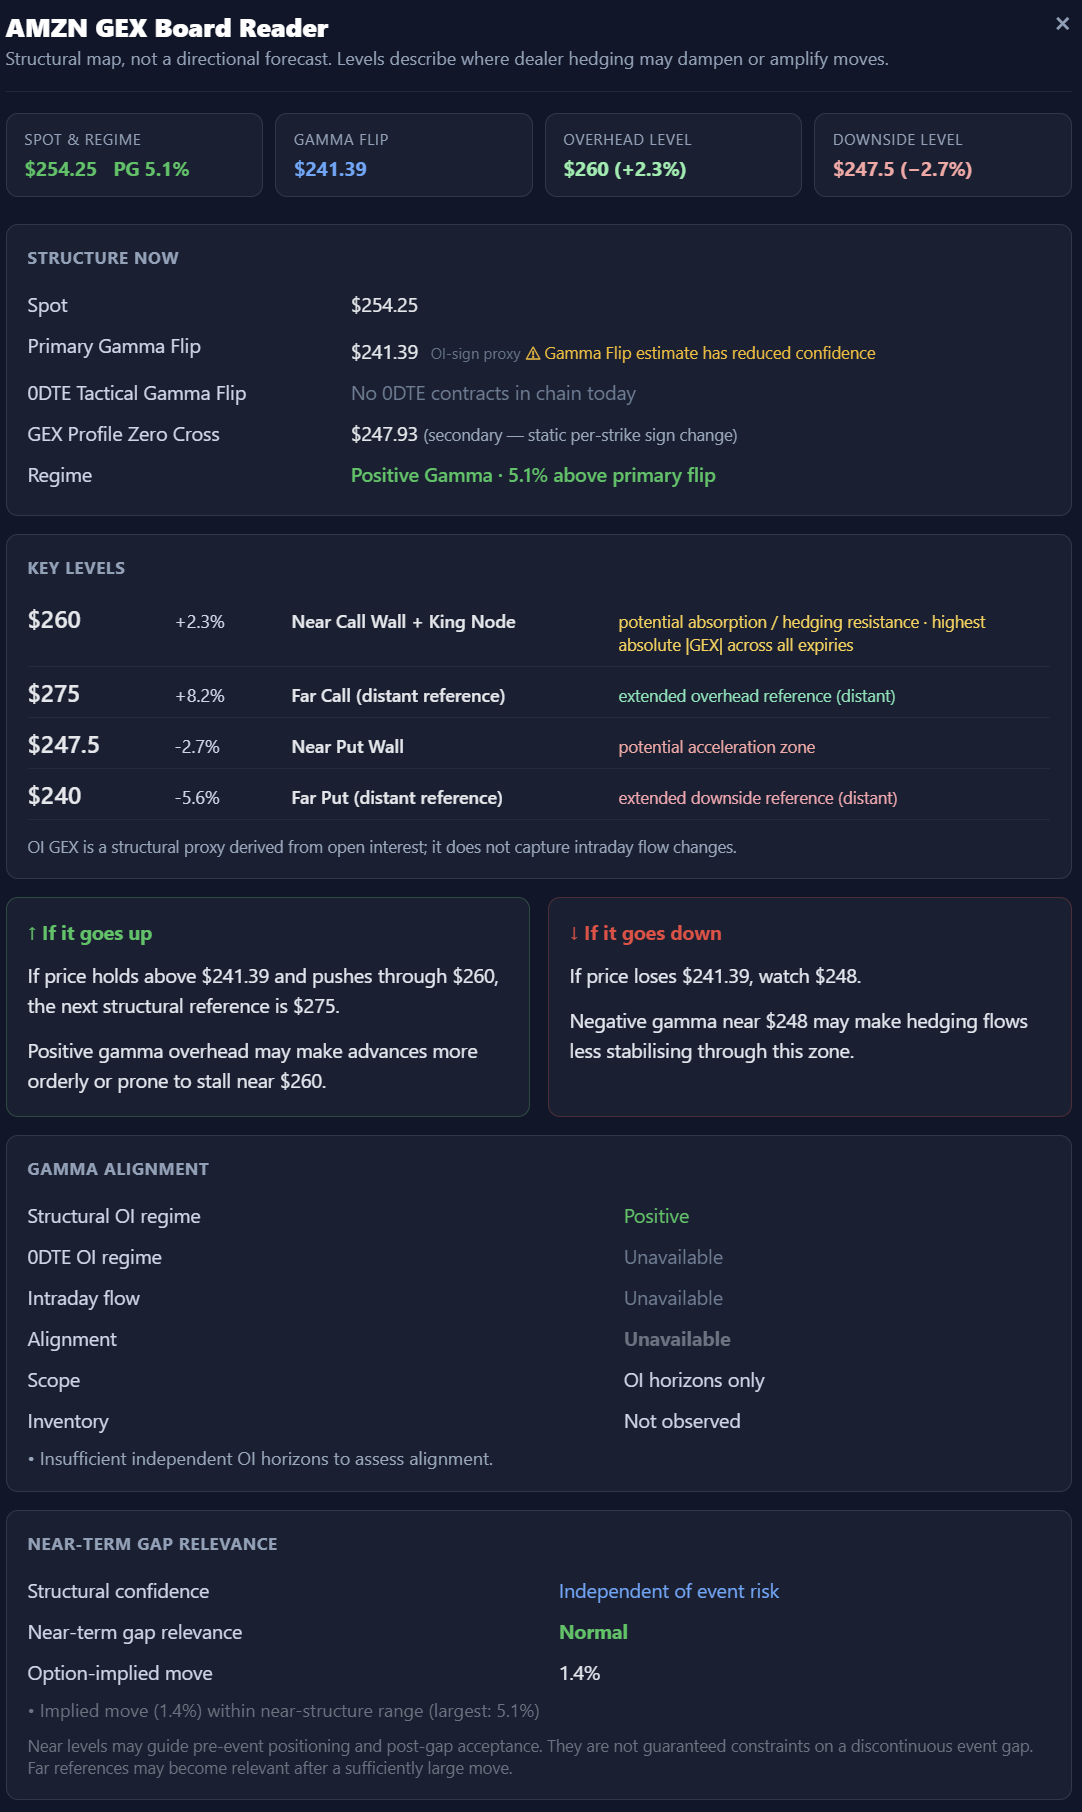
In this AMZN snapshot, spot is $254.25 and the dashboard identifies a positive gamma regime. It reports the flip distance as 5.1% of spot, with the primary gamma flip at $241.39. Measured from the flip level itself, spot is approximately 5.3% higher. The flip estimate is also explicitly marked as having reduced confidence.
The first overhead reference is $260, where the Near Call Wall and King Node coincide. At 2.3% above spot, it is more immediately relevant than the distant $275 call-side reference. On the downside, the $247.50 Near Put Wall sits close to the $247.93 profile zero cross. If price weakens, that cluster comes before the lower primary flip at $241.39 and the $240 Far Put reference.
The option-implied move is 1.4%, placing both near walls outside that immediate reference. That does not make the walls irrelevant, but it does mean they should not be presented as expected destinations.
Just as important, the snapshot has no 0DTE contracts in the chain, no intraday-flow reading, and no cross-horizon alignment assessment. The honest read is therefore deliberately narrow: the settled OI structure is positive, $260 is the first overhead test, and roughly $247.50 to $247.93 is the first downside test. Price response must do the confirming.
Gamma Is Only One Dimension
GEX describes how estimated delta changes with price. The broader options structure also changes with volatility and time.
DEX provides an estimated directional starting point. Vanna helps describe how delta may change when implied volatility changes. Charm helps describe how delta may change simply because time passes. These forces can matter greatly around earnings, macro events, expiration, and the final hours of a 0DTE session.
A useful shorthand is:
DEX: the estimated starting exposure.
GEX: how that exposure may change with price.
Vanna: how it may change with volatility.
Charm: how it may change with time.
No single Greek describes the whole market. The value comes from understanding which force is most relevant to the session in front of you.
Five Mistakes to Avoid
Green means bullish and red means bearish
Positive gamma is associated with dampening. Negative gamma is associated with amplification. Neither one determines direction.
The biggest node must hold
A concentration is a reference, not a force field. Price can move through it when liquidity, volume, news, or broader positioning overwhelms the estimated hedge effect.
The gamma flip is an entry signal
A regime boundary does not provide a thesis, stop, or catalyst. It tells you something about the environment around price.
Open interest reveals dealer inventory
It does not. The same open interest can arise from outright positions, spreads, covered calls, collars, customer option selling, and stock-tied trades.
A live GEX screen is a live position ledger
Open interest is settled data. Greeks can change intraday as price, volatility, and time change even when the number of contracts stays the same.
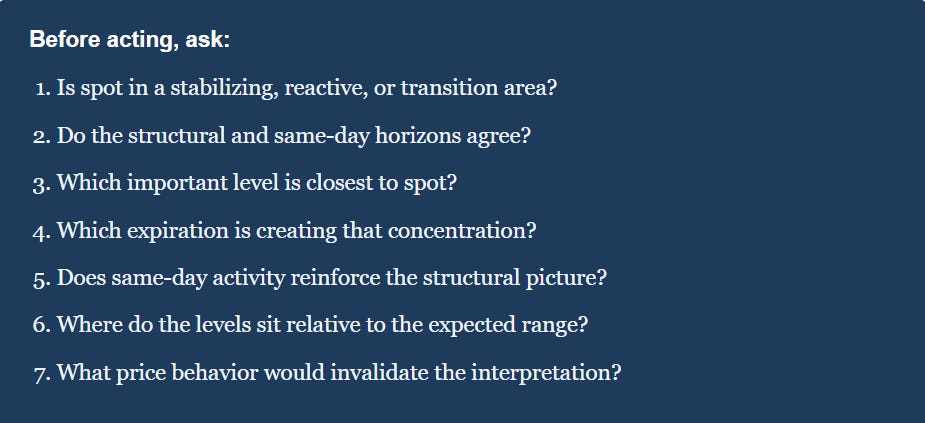
The 60-Second Gamma Check

Sources
