

Rhodie House Options Intelligence | Investment Note | September 25, 2026
META: Long | NVDA, AVGO, MRVL, VRT, CEG: Long | BE, MU, IREN, NBIS: Watching | DOCN: Cautious
All prices as of September 25, 2026 close.
For informational purposes only. Does not constitute investment advice. Rhodie House Options Intelligence and associated persons may hold positions in securities mentioned. Options flow observations represent the analyst’s interpretation of observed market activity and do not constitute knowledge of any counterparty’s intentions or trading purpose. Past performance is not a reliable indicator of future results. Not for redistribution.
THE CALL
META is a long. The advertising business generates substantial cash; the AI infrastructure investment is being funded from operations, not from balance-sheet distress; and the Muse personal AI agent launch shows the company has a credible distribution path for AI monetization at scale. The capex ramp is real and large, but so is the cash generation.
The relevant bottleneck suppliers, NVDA for GPU compute, AVGO for custom silicon, MRVL for interconnect, VRT for thermal management, and CEG for nuclear power, sit in the direct path of that spending and carry identifiable near-term catalysts. September options flow across this universe is broadly constructive, though the prints support a watching brief rather than high-conviction directional calls.
The current 2026 capex guidance of $130-145B is already set. Meta raised $24.91B net from senior notes in May 2026 and made no share repurchases in the first half. The financing is not a scenario to watch; it is already underway. Q2 2026 free cash flow was $784M for the quarter. The sharper investment question is not whether META can afford the buildout, but whether it can earn an adequate return on a program to which it is already substantially committed, using corporate bonds, partner capital, leases, and possibly equity, while keeping the core advertising engine strong. The market is pricing that question imprecisely in both directions.
WHAT THE MARKET MAY BE MISPRICING
The buildout is more committed than the annual capex guidance implies. The bear narrative treats META’s infrastructure buildout as a discretionary spend that management can reverse. The contractual picture is more complicated. At June 30, Meta disclosed approximately $279B of leases not yet commenced and approximately $349B of non-cancellable contractual commitments; these are different accounting categories and should not be added, but they jointly establish that a portion of future spending is already locked. Meta entered additional data center leases of approximately $68B in July. GPU hardware has a secondary market and is recoverable. Purpose-built facilities, signed power commitments, and lease obligations are not. The “we can slow down” optionality applies at the margin; it does not apply to what has already been signed.
Muse as a distribution play, not a model capability play. META does not need to build the best AI model; it needs to put a capable AI agent in front of three billion people at near-zero marginal distribution cost. If Muse achieves meaningful weekly-active retention, the value is in distribution leverage, not model superiority. The market tends to frame the AI competition as a model race. For META, it is a reach-and-retention race, which is a different contest and one META is better positioned to win.
Muse’s compute costs need a revenue line, and the revenue line is subscription, not ad targeting. Meta has publicly stated that Muse conversations are not shared with its ad targeting systems. The commercial case therefore rests on subscription pricing, per-task fees, or engagement effects, not on inference costs being amortized through higher CPMs. If Muse builds daily habit, META has a product it can charge for at scale: three billion addressable users at even modest subscription penetration is a material revenue opportunity, independent of any ad-signal component. The market is probably not pricing a scenario where Muse achieves meaningful subscription conversion, which means the risk is asymmetric if early retention data holds.
What Would Change My Mind
Advertising revenue growth below 10% YoY for two consecutive quarters. The capex is fundable from operations at current margins. A sustained advertising deceleration changes the math materially.
Muse weekly-active retention at 90 days well below what you would see from a new social product finding its audience. Strong install numbers mean nothing if users do not return. A sustained failure to build habit would undermine the subscription case regardless of how it is measured.
NVDA supply compression that limits META’s ability to deploy committed capex. A significant shortfall in Blackwell allocation would delay the revenue timeline.
EU Digital Markets Act enforcement that requires META to open its agent distribution layer. If regulators force interoperability at the agent layer, the monetization multiple on Muse’s user base compresses.
A second Reality Labs-style multi-year write-down with no path to revenue. This is a low probability but it is what a genuine model failure would look like.
REPORTED FINANCIAL FACTS
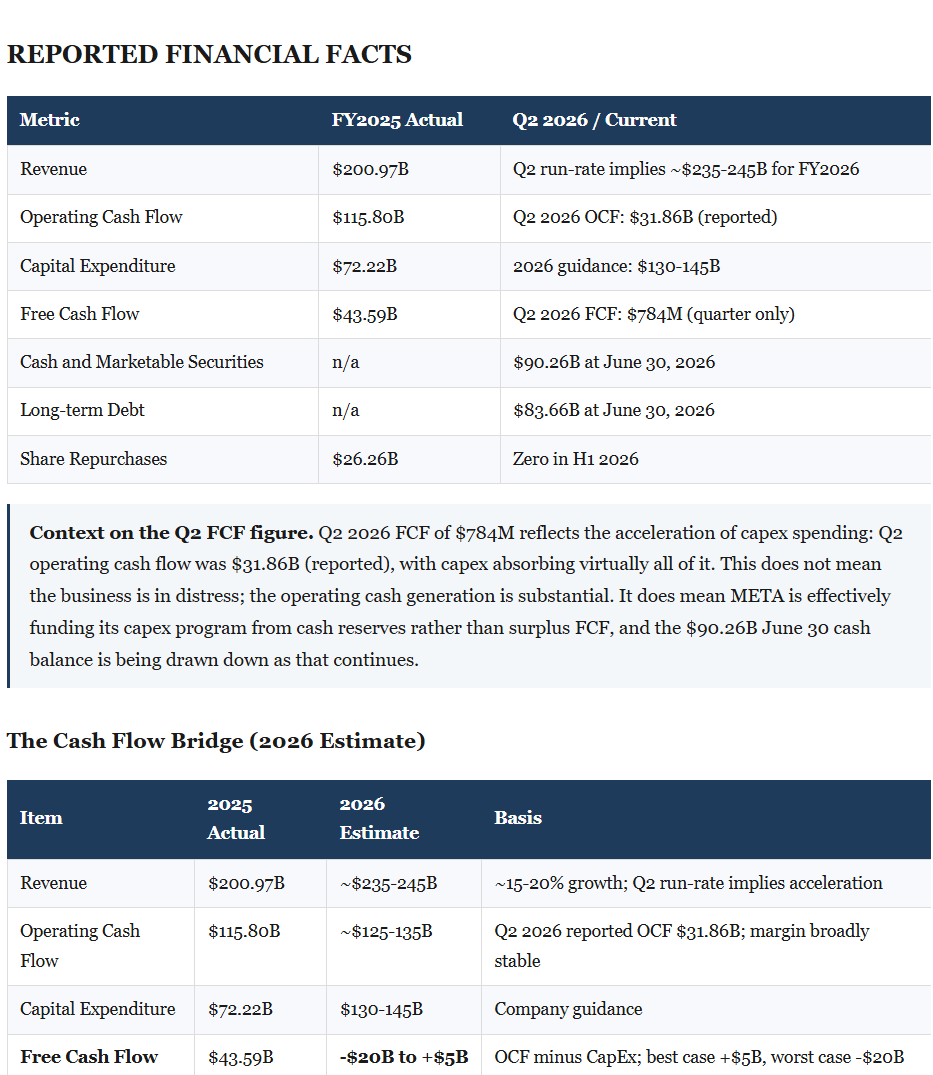
Context on the Q2 FCF figure. Q2 2026 FCF of $784M reflects the acceleration of capex spending: Q2 operating cash flow was $31.86B (reported), with capex absorbing virtually all of it. This does not mean the business is in distress; the operating cash generation is substantial. It does mean META is effectively funding its capex program from cash reserves rather than surplus FCF, and the $90.26B June 30 cash balance is being drawn down as that continues.
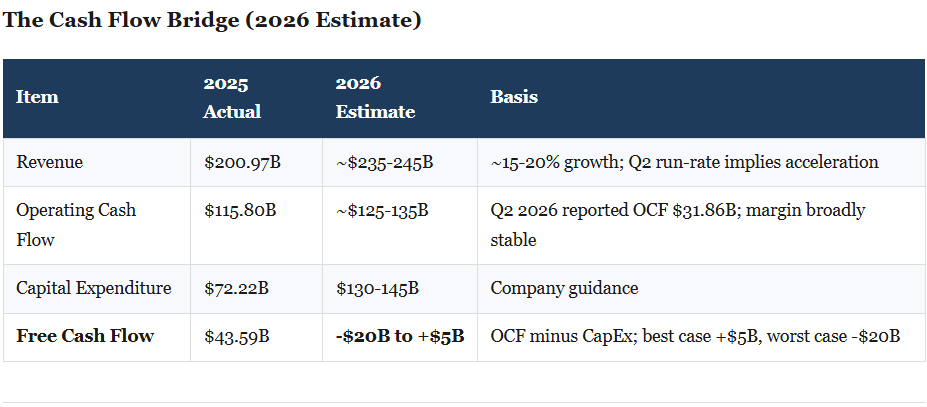
The Cash Flow Bridge (2026 Estimate)
CAPEX AND FINANCING
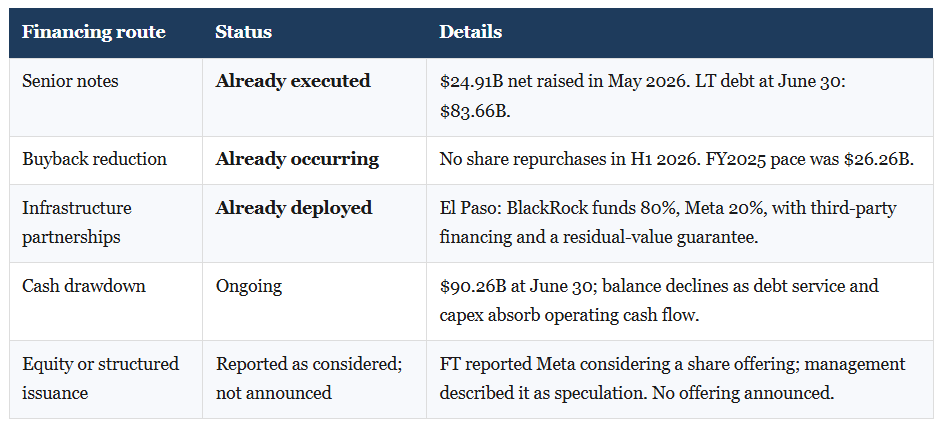
The 2026 capex guidance of $130-145B is in the public domain and the financing of it is already underway. Meta raised $24.91B net from senior notes in May 2026. It made no share repurchases in H1. Its Q2 10-Q explicitly leaves open further debt, equity, or other financing.
The view that META can “slow the build” if monetization disappoints understates the degree of contractual commitment already in place. At June 30, Meta disclosed approximately $279B of leases not yet commenced and approximately $349B of non-cancellable contractual commitments, of which roughly $81.65B falls due in 2027. It then entered additional data center lease agreements of approximately $68B in July. Meta also moved $10.8B into restricted cash equivalents in connection with infrastructure agreements. But they collectively establish that a significant portion of the buildout is locked in; the “we can stop anytime” optionality is weaker than the headline capex number alone suggests.
Meta is not relying solely on corporate bonds and operating cash flow. In July it announced a data center development venture in El Paso in which BlackRock-managed funds hold 80% and Meta holds 20%. The project includes third-party financing; Meta leases the campus and provides a residual-value guarantee. This structure reduces META’s near-term capital outlay without eliminating its long-term economic obligations.
MUSE: WHAT THE LAUNCH DATA SHOWS
Muse is META’s personal AI agent product. It is not a single unified video/audio/image/text model; that framing overstates what has been demonstrated. Muse is a conversational AI assistant designed to be embedded across META’s platforms and accessed through a standalone app. Its launch demonstrates a product strategy and a distribution approach.
The more important question is not whether Muse is the best model in the world, but whether META can retain users and eventually charge for the product. Meta has publicly stated that Muse conversations are not shared with its ad targeting systems, so the commercial path runs through subscription or engagement effects.
Early Adoption Indicators (September 2026)
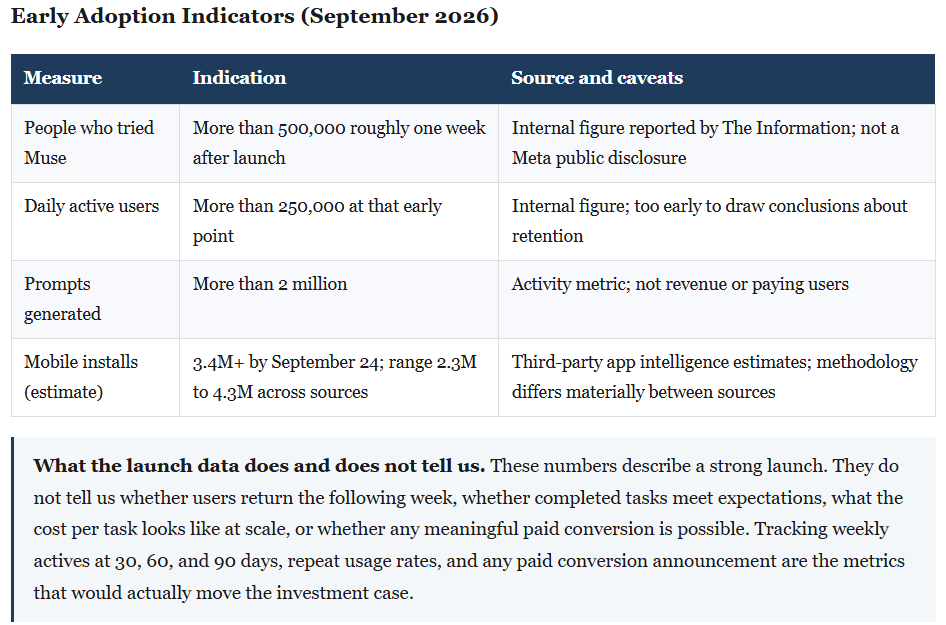
What the launch data does and does not tell us. These numbers describe a strong launch. They do not tell us whether users return the following week, whether completed tasks meet expectations, what the cost per task looks like at scale, or whether any meaningful paid conversion is possible. Tracking weekly actives at 30, 60, and 90 days, repeat usage rates, and any paid conversion announcement are the metrics that would actually move the investment case.
First-12-Day Comparison: Muse vs ChatGPT Mobile Launch
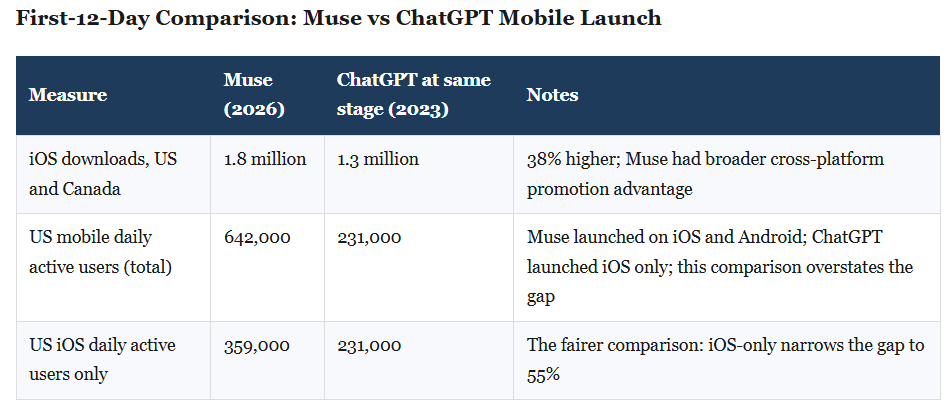
What the comparison does and does not establish. Muse’s first-12-day iOS adoption materially exceeded ChatGPT’s comparable launch. That is a meaningful data point. The qualification is that over 95% of Muse users in this early period also use Facebook. META promoted Muse through its existing platform notifications to a pre-existing audience of billions. ChatGPT had no equivalent distribution infrastructure in 2023. The comparison establishes that distribution is working; it does not establish that Muse competes head-to-head on product quality at equivalent conditions. Whether those users are still active at 30 and 60 days remains unanswered.
The Commercial Path
Meta has confirmed several commercial routes. Muse offers subscription plans for heavier use. It has connected to Shopify’s product catalog with planned integrations for major retailers. Meta One sells higher AI usage and business-agent capacity; Meta reports 15 million combined subscriptions and trials across those plans as of September 2026; these are not all Muse subscribers and the figure spans different products and trial periods.
Meta has confirmed that Muse conversations are not shared with its advertising systems. The computing costs must be justified by subscription revenue, commerce commission, or engagement effects, not by inference being paid for through higher CPMs. Whether that math works at realistic conversion rates is the open question.
Following the Connect developer conference, at least one major sell-side firm raised its META price target to $920 from $820, citing Muse’s early traction and distribution potential. Retention, monetization, and the return on the buildout program remain to be demonstrated.
SELECTED SEPTEMBER 2026 OPTIONS FLOW
The following covers the most informative prints from September 1-25, 2026. I am showing the actual trade packages rather than summaries, and I am giving my read on each with the uncertainty it deserves. In these descriptions, K = strike price and DTE = days to expiry. Large premium does not identify the holder, prove a directional bet, or establish that prints on different dates belong to the same position.
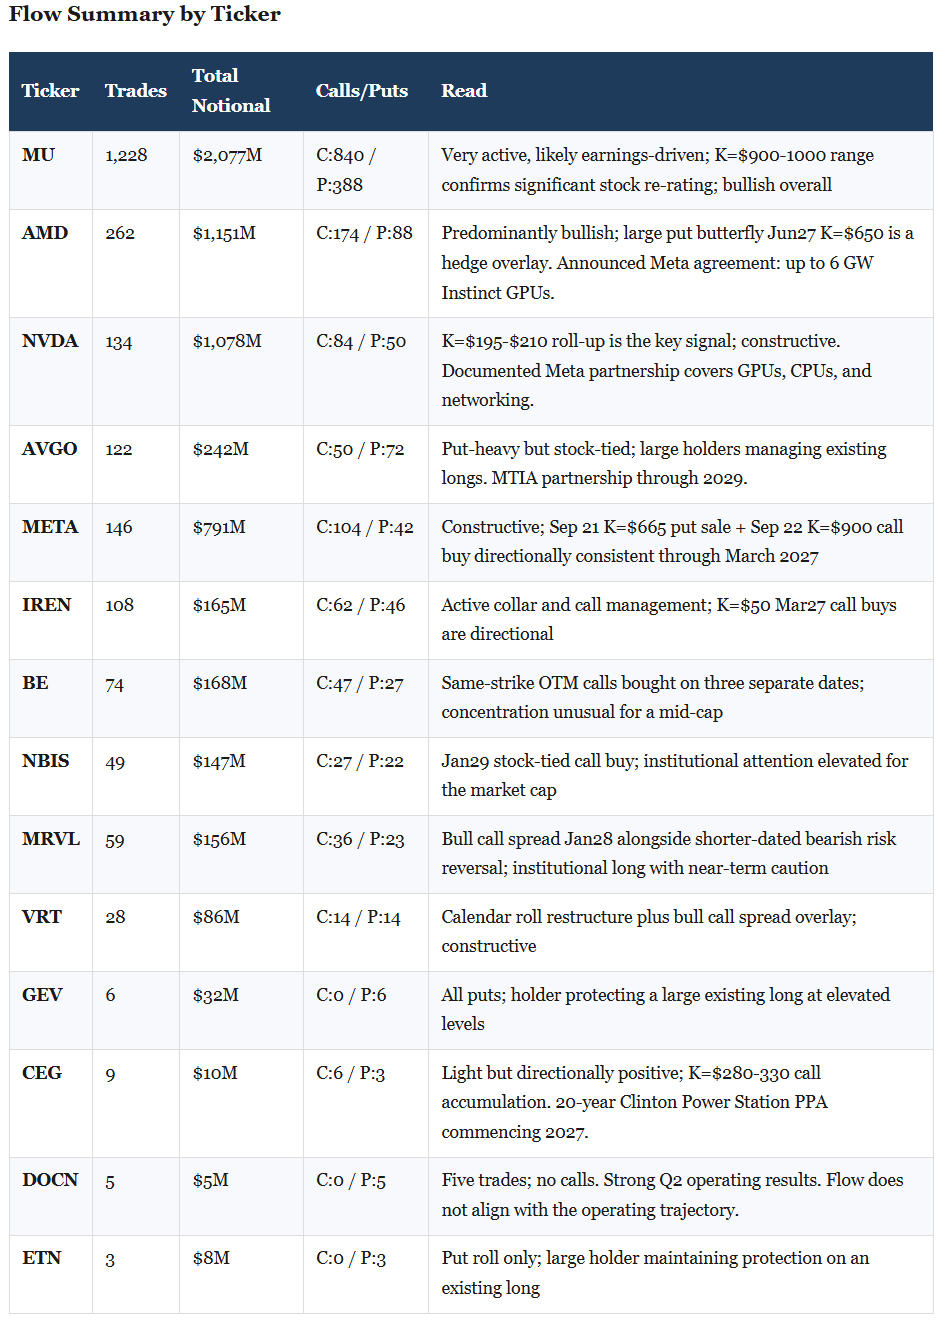
META — 146 trades, $790.6M total notional, 104 calls / 42 puts
Sep 21 | Puts Sold | K=665 | Mar27 | 8,630 contracts | $43.66M premium received
The seller received $43.66M to assume the obligation to buy META at $665 if the stock falls there by March 2027. At current levels near $720, this put is roughly 8% out of the money with six months to run. Selling premium of this size is consistent with either a financed long position or an outright view that META stays above $665.
My read: constructive on META above $665 over the next six months.
Sep 22 | Calls Bought | K=900 | Mar27 | 5,200 contracts
K=$900 calls on a stock near $720, six months to March expiry, roughly 25% out of the money. Considered alongside the Sep 21 put sale at K=$665, these two trades are directionally consistent, but they are on different dates and different sizes. I cannot confirm they share an owner.
My read: both prints point the same way over the same March expiry. Whether related or independently placed, the positioning above $665 and toward $900 by March 2027 describes a constructive thesis.
Sep 22 and Sep 24 | Deep ITM Calls Sold | K=5 | Dec27 / Dec28 | 478 + 350 contracts | ~$35M + $27M
Calls sold at K=$5 on a $720 stock are almost entirely intrinsic value. These are stock-tied. A large holder is rolling or managing delta on an equity position; this is not a directional options bet.
My read: position management by a large holder, not new directional information.
NVDA — 134 trades, $1,077.8M total notional, 84 calls / 50 puts
Sep 9 | Roll-up: Sold K=195 Sep26 / Bought K=210 Nov26 | ~25,000 contracts each side | ~$150-180M net notional
An institution rolled a large K=$195 September call position up to K=$210 and out two months to November. Rolling up means they chose to extend the position at a higher strike, paying net premium to do so.
My read: this adds bullish exposure at a higher strike. It is the clearest constructive signal in the September NVDA flow.
BE (Bloom Energy) — 74 trades, $168.4M total notional, 47 calls / 27 puts
Sep 11 | Calls Bought | K=290 | Feb27 | 2,050 contracts | $12.15M
Sep 15 | Calls Bought | K=290 | Apr27 | 2,275 contracts | $13.51M
Sep 23 | Calls Bought | K=280 | Apr27 | 900 contracts | $6.05M
Three separate call purchases over 12 days: same strike (or adjacent), same buyer-initiated aggressor, different expirations. Total premium paid: $31.71M. BE trades near $250-260, so K=$280-290 is roughly 10-15% out of the money. $31.71M in OTM call premium over 12 days on a mid-cap power company is an unusual concentration.
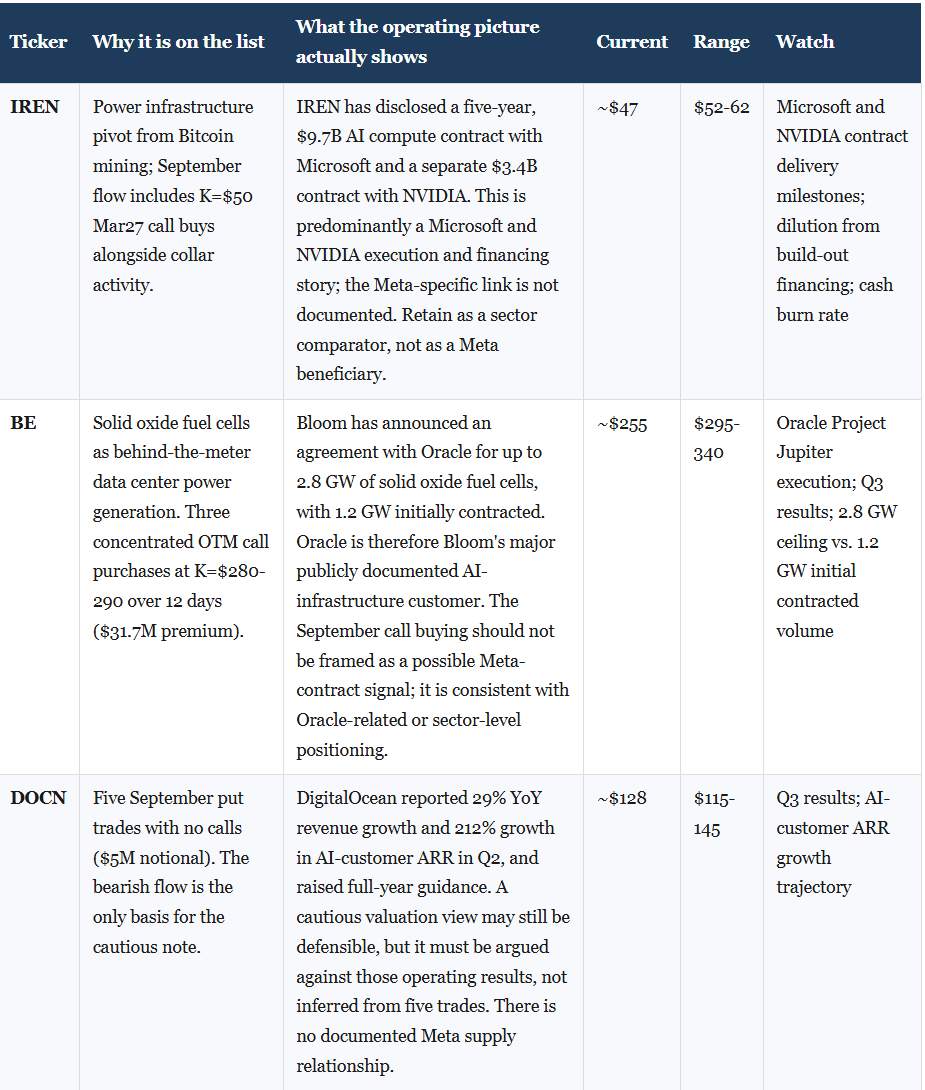
My read: the pattern is consistent with pre-announcement accumulation. Note: Bloom’s primary publicly documented large customer is Oracle (up to 2.8 GW fuel cell agreement). I would not frame this as a possible Meta-contract signal; it is consistent with Oracle-related or sector-level positioning.
NBIS (Nebius) — 49 trades, $146.9M total notional, 27 calls / 22 puts
Note: the September flow below preceded the public announcement of Nebius’s Meta agreement. The flow retains descriptive value but should not be treated as the primary evidence for the investment case.
Sep 8 | Puts Bought K=260 Jan27 (4,000 contracts, $24.74M) + Calls Bought K=290 Jan27 (4,000 contracts, $16.38M) | Same size, same expiry
Equal size on both sides at the same expiry. Buying both sides is consistent with a holder establishing initial exposure while protecting against a binary outcome, or with high implied volatility expectations.
Sep 16 | Calls Bought | K=210 | Jan29 | 900 contracts | $10.58M | Stock-tied
Two-year duration call purchase at K=$210 on a stock near $270-280. Stock-tied.
My read: large-holder accumulation ahead of a known catalyst. The investment case now rests on the Nebius-Meta agreement terms.
DOCN (DigitalOcean) — 5 trades, $5.0M total notional, 0 calls / 5 puts
Sep 15 | Put Spread | K=115/100 | Oct26 | $1.09M
Sep 23 | Put Spread | K=135/120 | Oct26 | $3.30M
Two put spreads, both October expiry. No calls in the month.
My read: five trades with no calls is a cautious signal, but five trades is not enough to establish institutional shorting or infer a specific catalyst. Treat DOCN as cautious rather than avoid based on this flow alone.
Flow Summary by Ticker
RISK FACTORS
Capex at 100%+ of OCF is unprecedented for META and almost unprecedented for any large US technology company. Amazon, Google, and Microsoft all ran capex programs in the range of 25-40% of group revenue during their cloud buildouts. META in 2026 is potentially at 55-60%. Those companies had cloud businesses generating recurring revenue from day one. META’s AI infrastructure primarily serves its own platforms, with monetization dependent on demonstrating and pricing AI capabilities. The timeline to revenue from this level of investment is uncertain and the bear case involves a substantial drawdown from current levels.
The Reality Labs precedent is a genuine risk, not a rhetorical counterpoint. $47B in losses over four years on spatial computing and the metaverse represents a demonstrated willingness to sustain substantial capital allocation to a vision that has not produced revenue at scale. AI is structurally different: it operates on existing platforms rather than requiring new hardware adoption. But the pattern of sustained investment without near-term return is the same.
Apple’s device-level privacy architecture is a structural threat that does not go away. iOS controls the primary on-device experience for approximately 1.5B premium users. If Apple’s on-device AI integration reduces the engagement share that META captures from those users, advertising signal quality deteriorates at the same time META is investing in AI infrastructure that depends on that signal.
Regulatory risk on the agent layer is underpriced. The EU Digital Markets Act has already forced significant product changes across META’s platforms. If regulators define AI agents as a gatekeeping layer subject to interoperability requirements, the monetization multiple on Muse’s user base compresses.
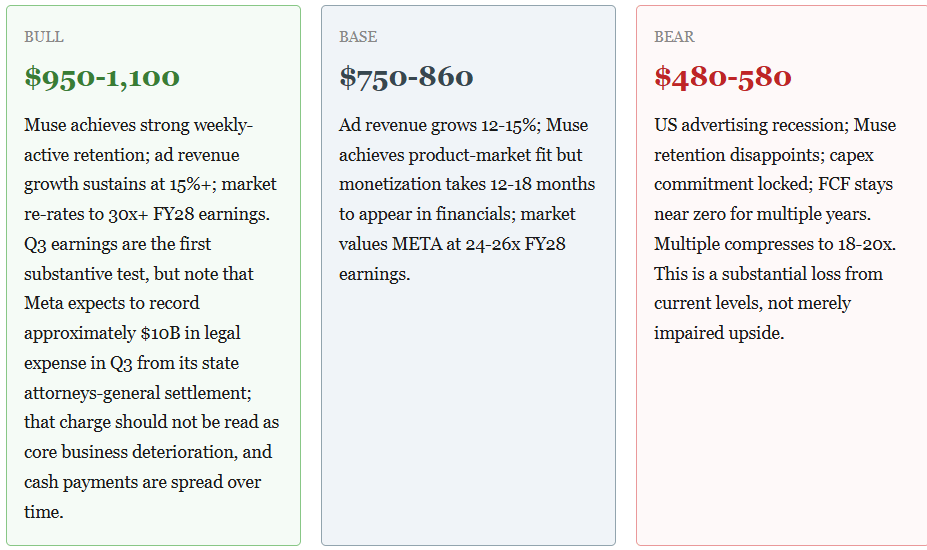
PRICE RANGES: META
These are ranges, not point estimates. The precision of point-estimate price targets is false; the ranges reflect genuine uncertainty about AI monetization timing and the capex funding cost. Read these as a thesis and watchlist, not as formal estimates.
APPENDIX A: SUPPLIER CATALOGUE BY META RELATIONSHIP
Companies are divided into three tiers: those with a documented direct agreement with Meta, those with structural position in the AI buildout supply chain, and a watch list of companies where the investment thesis requires separate evidence.
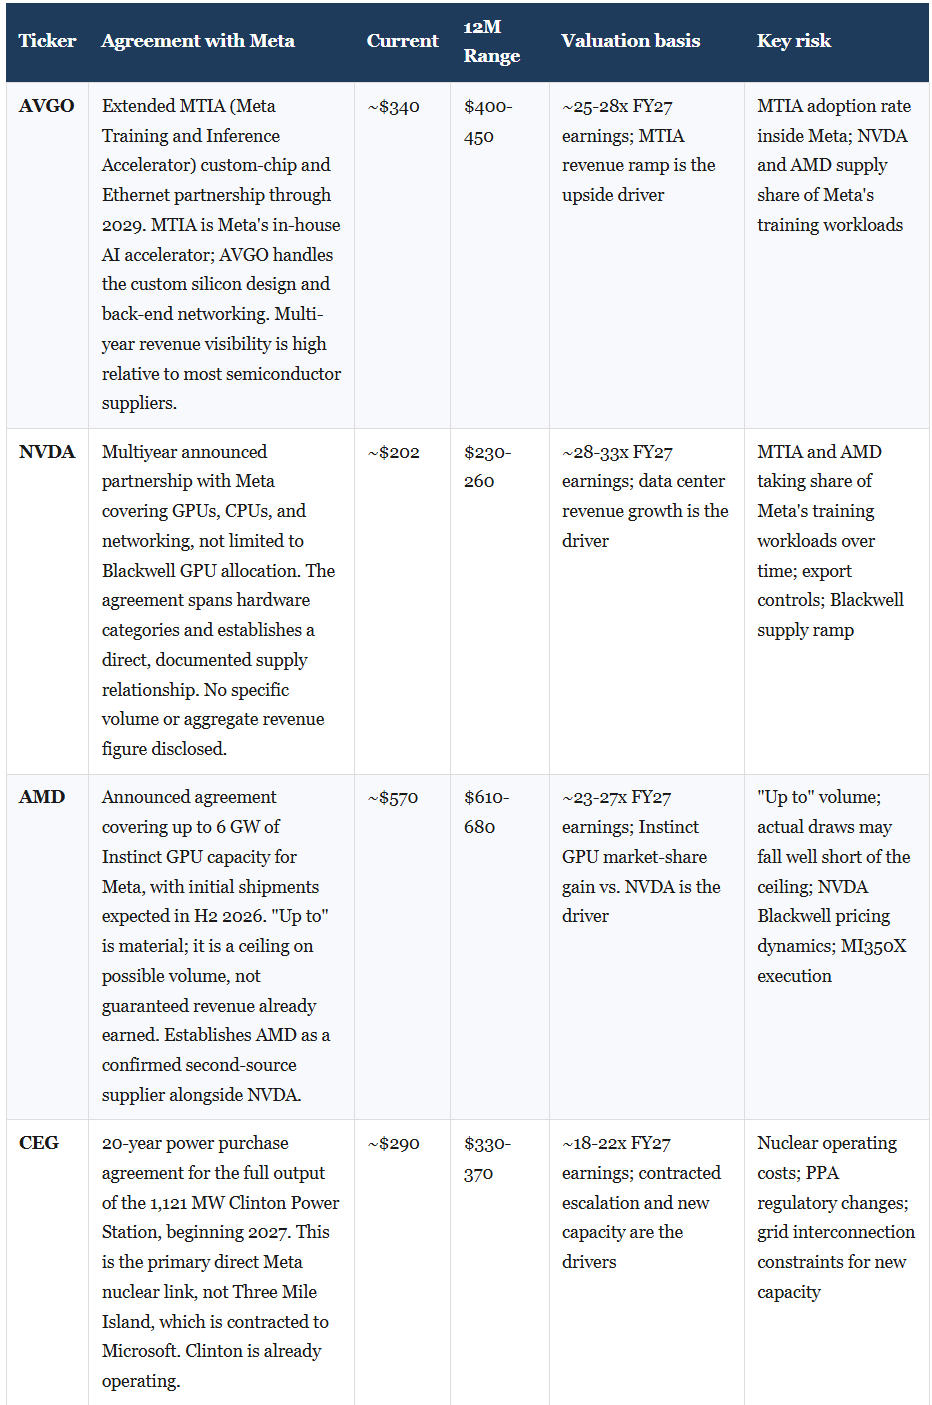
A signed agreement, a place in the AI supply chain, and an attractive stock are three separate propositions. For each Tier 1 name, the relevant questions are: how much revenue does the agreement realistically capture, and when; what is the incremental margin on that revenue; what capital does the company need to deliver; how much of that upside does the share price already reflect. The 12-month ranges below should be read as a thesis and watchlist, not as formal estimates. Prices approximate as of September 25, 2026 close.
Tier 1: Documented Meta Counterparties
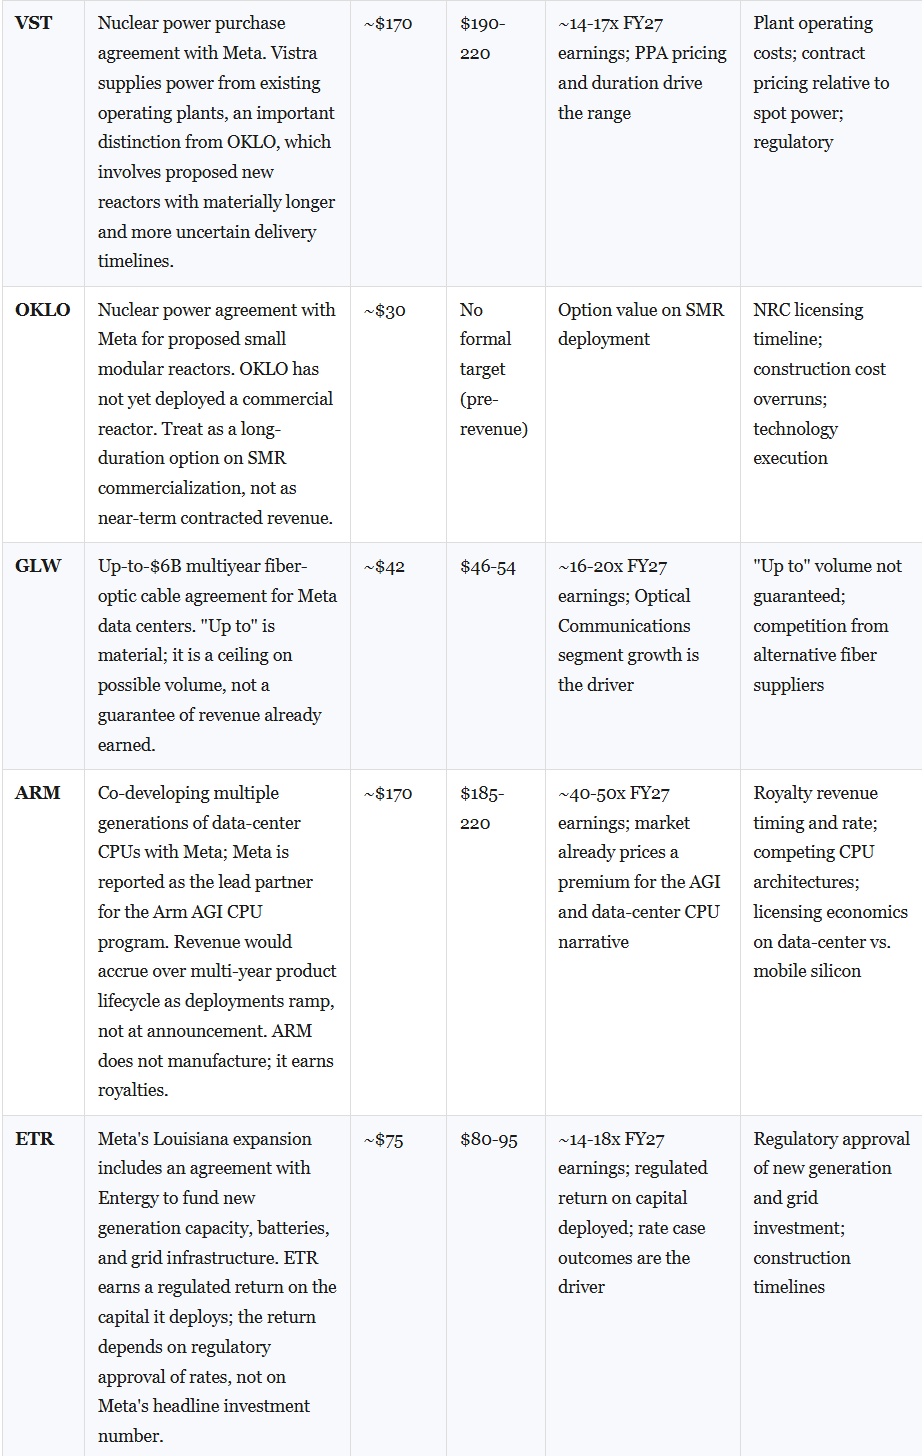
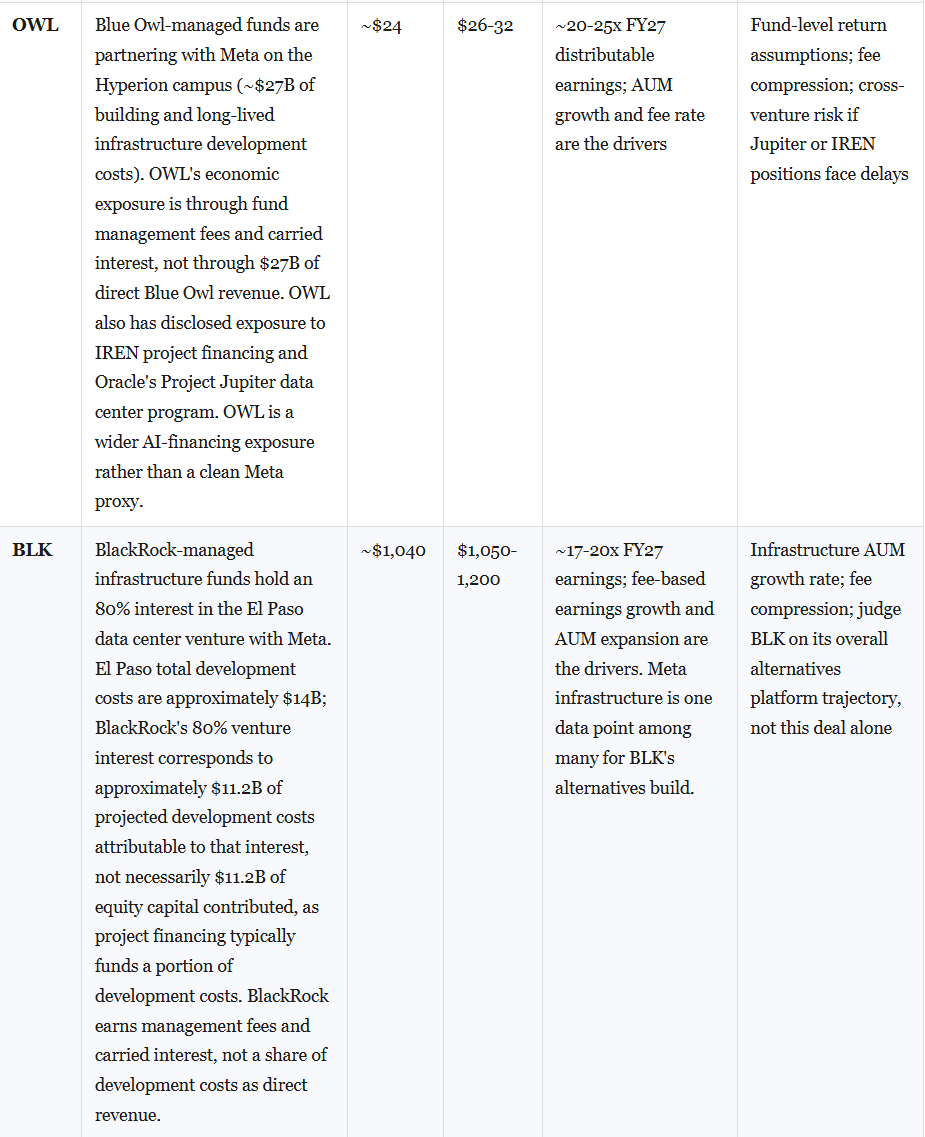
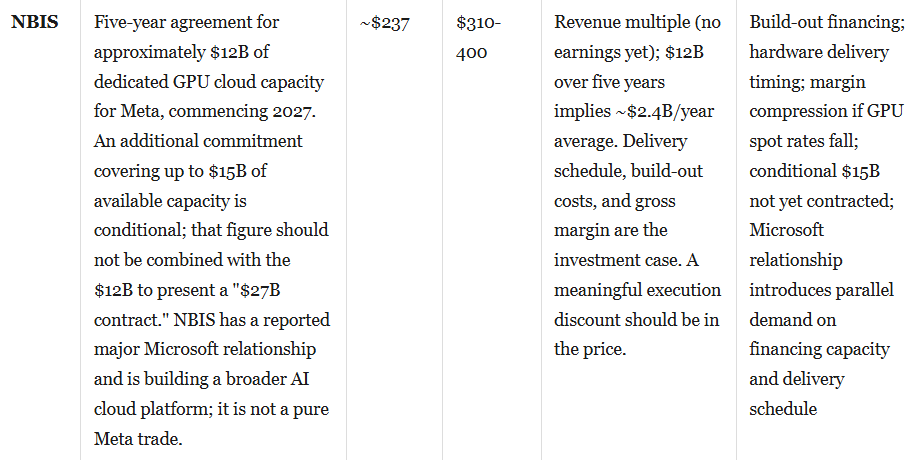
Tier 2: Structural AI Buildout Beneficiaries
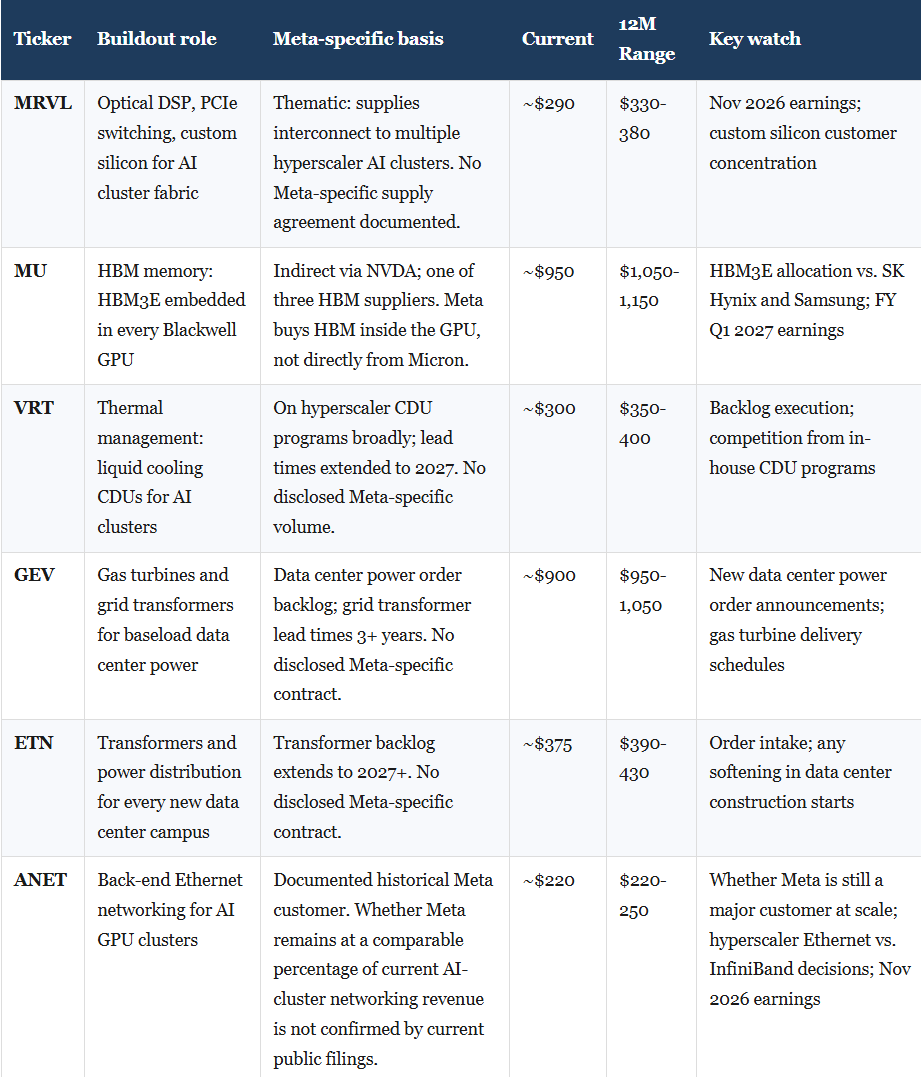
Tier 3: Watch List
Cautionary Comparator: Oracle (ORCL)
Oracle does not belong in the Meta beneficiary ranking, but it warrants a separate note because it surfaces repeatedly in Meta-adjacent AI infrastructure reporting and its outcome can affect several names in the tables above.
Oracle has a documented cloud relationship with Meta and is executing a large AI data center programme; Project Jupiter is one significant project within it. Bloom Energy’s largest disclosed fuel cell agreement is with Oracle across its projects. Blue Owl has reported exposure to the developer side of Project Jupiter. Several names in this report therefore have Oracle as a major customer or financing counterparty alongside their Meta exposure.
Oracle reportedly sent a contractual notice to the external developer in connection with Project Jupiter, concerning potential delays and payment obligations; it is a project-specific execution risk, not evidence of programme cancellation. Oracle stated publicly that the project remained on schedule; Blue Owl stated the notice did not change its financial commitments. Assess ORCL on its own AI programme economics: AI cloud revenue trajectory, capex commitment versus free cash flow, and delivery across all data center projects, not as a proxy for Meta’s spending.
ORCL current price: ~$137 | Watch: Project Jupiter delivery milestones; AI cloud revenue growth vs. capex; Q2 FY27 results
APPENDIX A SUPPLEMENT: SCENARIO ANALYSIS, FOUR KEY COUNTERPARTIES
The 12-month ranges in Appendix A reflect the investment thesis, not fully underwritten price targets. This supplement shows the specific Meta-related inputs that would move those ranges for the four names where the relationship is most material to the earnings case. All non-disclosed inputs are labeled as assumptions.
NBIS: Modeled from disclosed contract terms
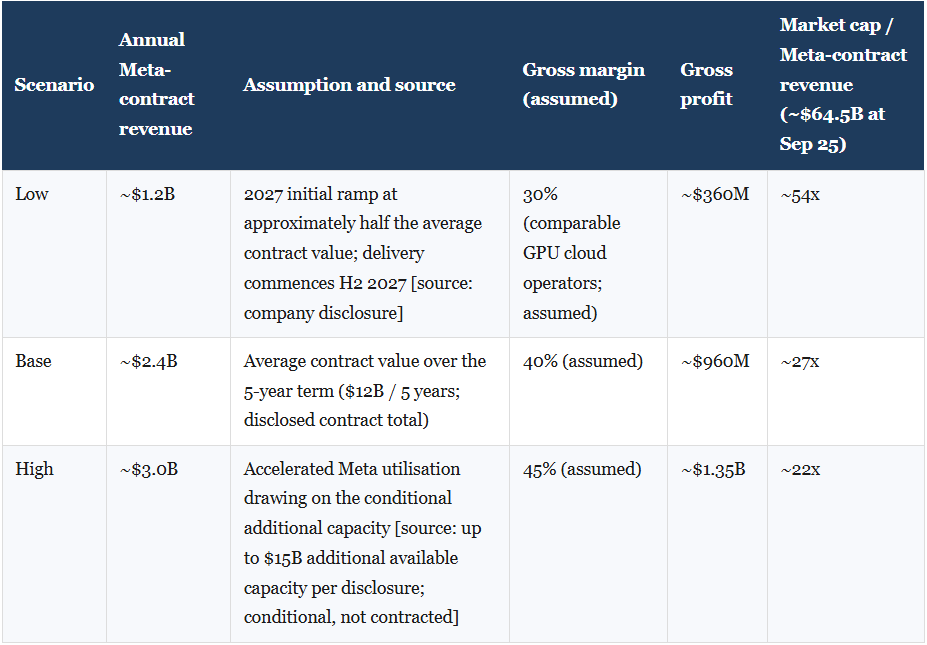
What moves the thesis range ($310-400): The final column divides the September 25 market cap (~$64.5B) by Meta-contract annual revenue only; it overstates the effective multiple to the extent NBIS has other contracted revenue (the Microsoft relationship being the primary example). At base, the market cap implies approximately 27x Meta-contract annual revenue before accounting for any other customer. The thesis range requires confirmed H2 2027 delivery and a gross margin trajectory above 40%. A financing shortfall or delivery delay has no earnings cushion.
AVGO: Scenarios anchored to disclosed AI revenue run-rate
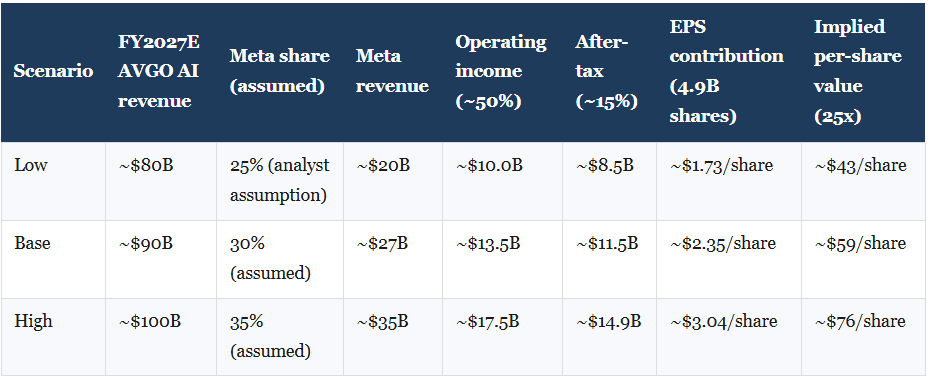
What moves the thesis range ($400-450): At base, the Meta program implies approximately $59/share attributable to the assumed Meta revenue at a 25x earnings multiple, not $59 of additional upside from today’s price, as some portion of this business is likely already reflected in the current ~$340. The thesis range depends more on AVGO’s total AI revenue trajectory and margin than on Meta’s share alone. The critical input is AVGO’s FY2027 AI revenue guidance at the next earnings release.
CEG: Incremental PPA premium over counterfactual
Clinton Power Station: 1,121 MW, 20-year PPA commencing 2027. Annual generation at approximately 92% capacity factor: ~9.0 TWh. The relevant calculation is the incremental premium the Meta PPA earns above what CEG would have received selling that power otherwise. The $50/MWh counterfactual market price is an analyst assumption for MISO-area nuclear baseload without a data-center PPA. The Meta PPA price is not publicly disclosed. After-tax calculation uses ~25% effective rate. Diluted shares: ~360M (reported).
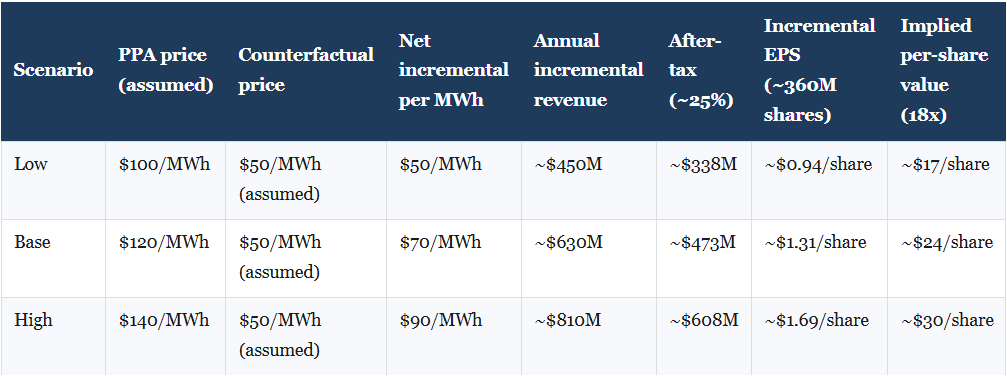
What moves the thesis range ($330-370): At base, the Meta PPA supports approximately $24/share as a market-multiple illustration, applying 18x earnings to one year of incremental after-tax cash. This is not a discounted present value of the 20-year contract; a full DCF over the PPA term would produce a different and more defensible figure. Both the PPA price and the counterfactual power price are unconfirmed. The 20-year duration provides structural visibility; the risk is regulatory or operating, not a near-term renegotiation.
ARM: Incremental royalty and earnings
ARM licenses CPU architecture and earns per-chip royalties on shipments; it does not manufacture. The Meta AGI CPU co-development generates incremental royalties when CPUs are deployed at scale, not at announcement. Both the royalty rate and deployment volumes below are analyst assumptions, not disclosures. Diluted shares: ~1.07B (Arm annual filing).
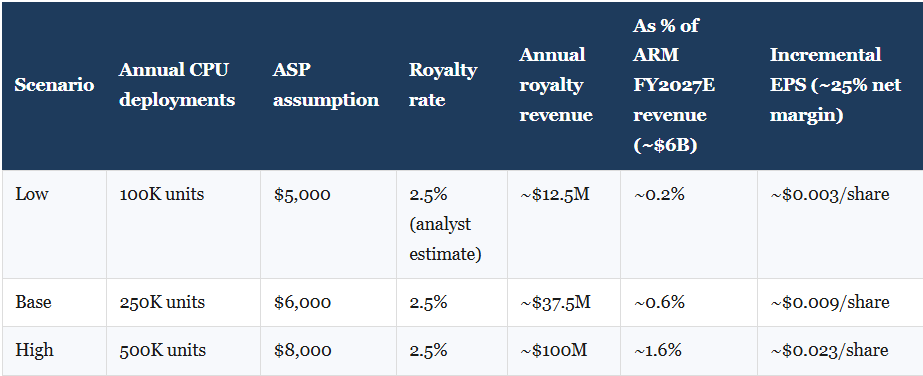
What moves the thesis range ($185-220): In no near-term scenario does the Meta AGI CPU program move ARM’s reported earnings materially. ARM trades at approximately 40-45x FY27 earnings on the thesis that it wins data-center CPU attach rate across multiple hyperscalers. The Meta co-development validates the AGI data-center platform; the Meta-specific royalty line is not what drives the multiple.
APPENDIX B: CAPITAL RAISE TRIGGER PATTERN IN BOTTLENECK COMPANIES
A pattern that has repeated across the infrastructure buildout cycle: institutional options accumulation precedes a contract announcement, the stock re-rates, and the company raises capital to fund the contracted capacity. This is not predictive but it is a recognizable sequence worth tracking.
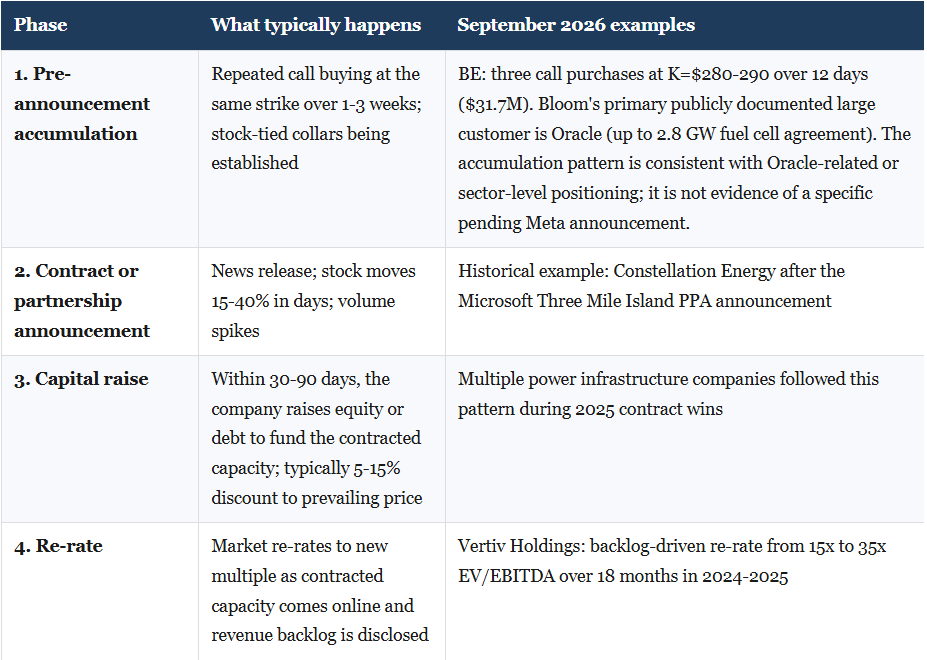
In September flow, BE shows the most concentrated call accumulation at a consistent strike. IREN has near-term call spread positioning. NBIS carried elevated notional relative to its market cap, but the context has changed since the flow was observed: Nebius has since announced a direct Meta agreement, which means the September accumulation preceded a public catalyst. The trigger pattern template is a framework for organizing attention. Observing Phase 1 characteristics is a watch item, not a prediction of what follows.
Rhodie House Options Intelligence. For informational purposes only. Not financial advice. Not for redistribution to third parties.