
Know What's Inside the Instruments You Trade
Tools | Rhodie House Options Intelligence | April 2026

One of the most common follow-up questions after a large options flow print is: which ETFs carry this name, and how much weight does it have in them? The second question, especially during earnings season, is: does this name report this week?
Until now those questions required separate lookups - checking ETF factsheets, cross-referencing index weightings, tracking down the earnings calendar independently. We have built a dashboard that answers all three in one place. It is called ETF Earnings Coverage, and it is live now for all members.
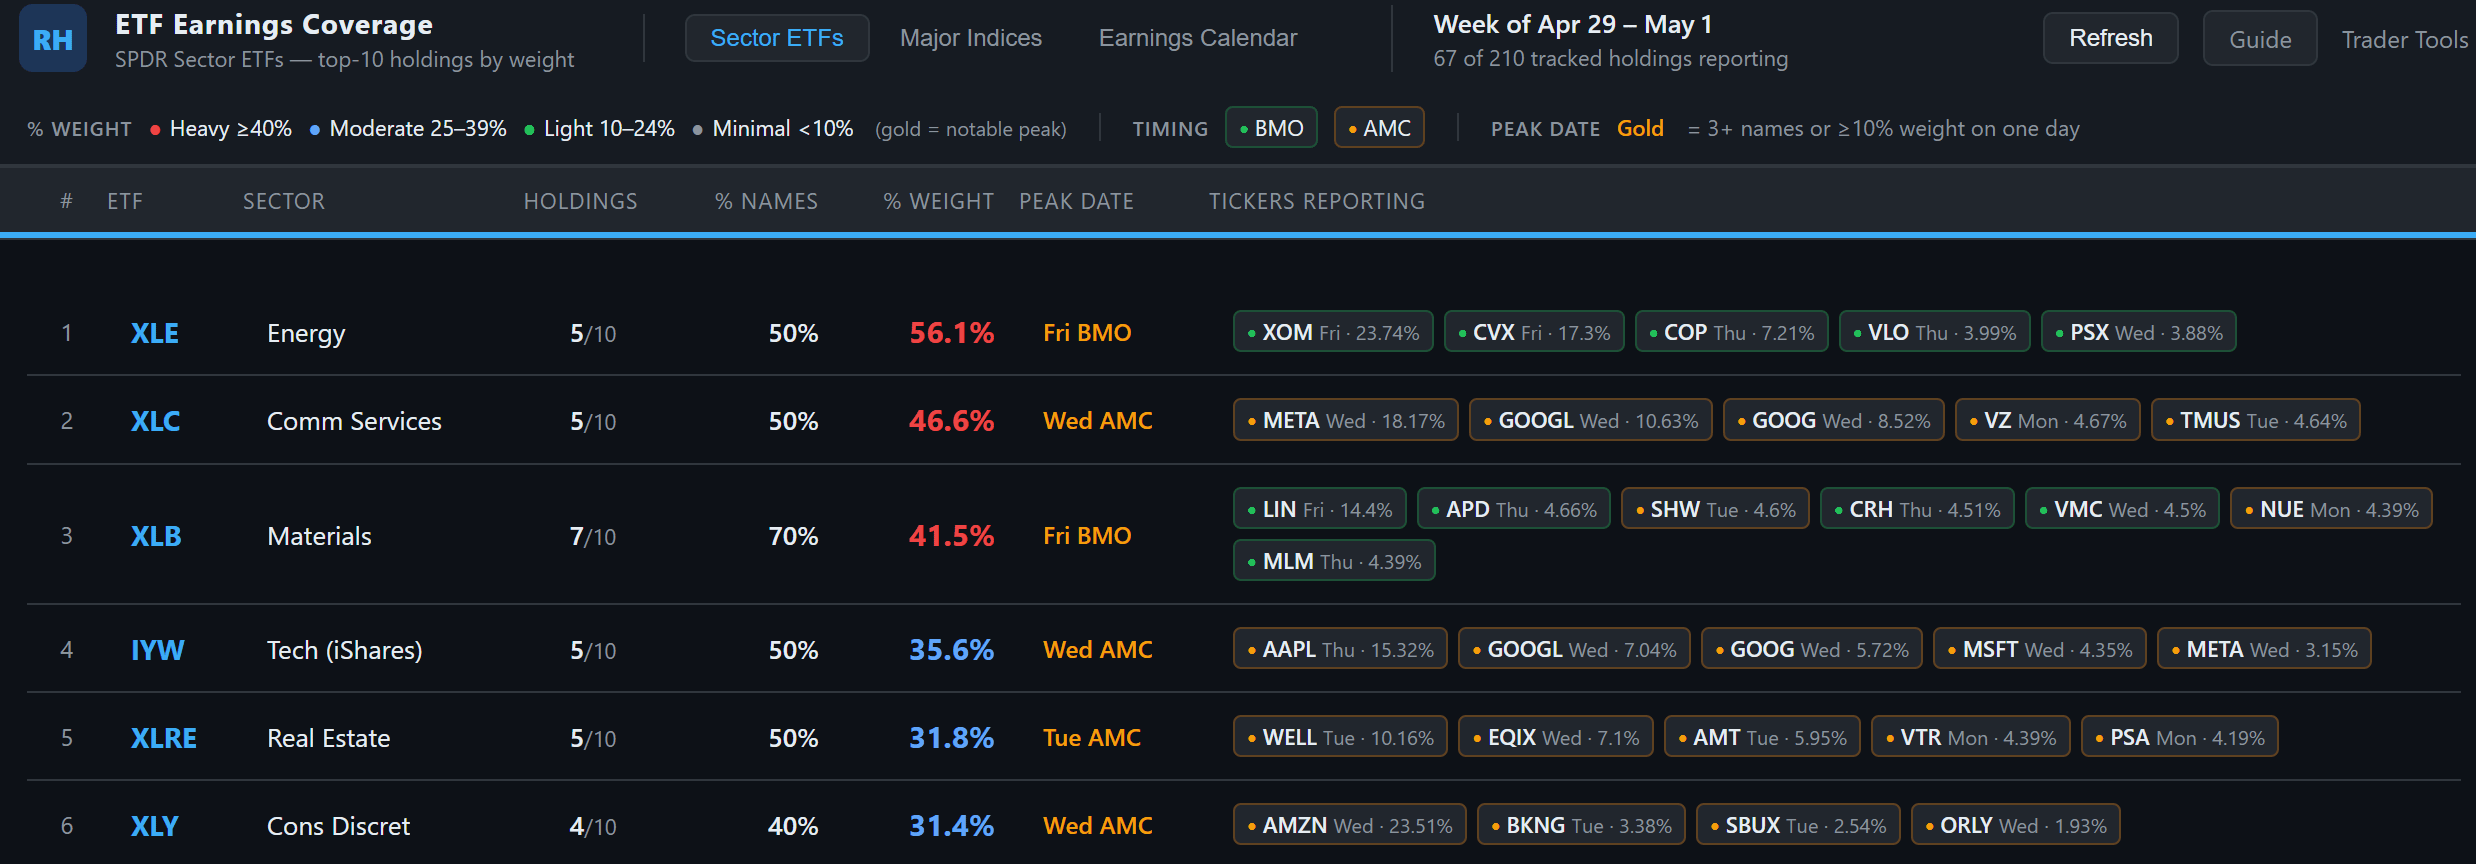
Sector ETFs
The Sector ETFs tab covers 21 tracked products: the 11 SPDR Select Sector funds, semiconductors (SMH and SOXX), biotech (IBB), regional banks (KRE and KBE), oil services (OIH), energy exploration (XOP), and technology (VGT and IYW), plus REITs (VNQ). These are the instruments that show up most consistently in the options flow feed.
For each ETF, the table shows how many of the names we track in the flow feed it holds, what percentage of its overall index those names represent on both a net and weighted basis, the peak single-constituent weight, and the top tickers driving that exposure. The table is ranked by holdings count so the most broadly diversified products sit at the top.
The weight percentage is color-coded by tier. Red means the tracked names make up 40% or more of the ETF’s index weight - a large institutional position in one of those names can move the ETF. Blue is 25 to 39%. Green is 10 to 24%. Muted grey is below 10%, where a single name has limited ETF-level impact regardless of flow size.
When a $50 million call sweep hits SMH, this tab tells you in seconds that the top semiconductor names account for roughly 80% of the index by weight, and which five tickers are doing most of the work. That context changes how you interpret the flow and what, if anything, you do with it.

Major Indices
The Major Indices tab shows how the names in our flow universe contribute to SPY, QQQ, and DIA. For each index you can see the constituent weight and rank within that product.
The reason this is worth having alongside the sector ETF data: a name can have a modest weight in its sector ETF but be a top-10 holding in QQQ or SPY at the same time. A large directional flow print on a mega-cap carries index-level implications that the sector view alone will not surface. Both layers of context matter, and this tab gives you both in one view.

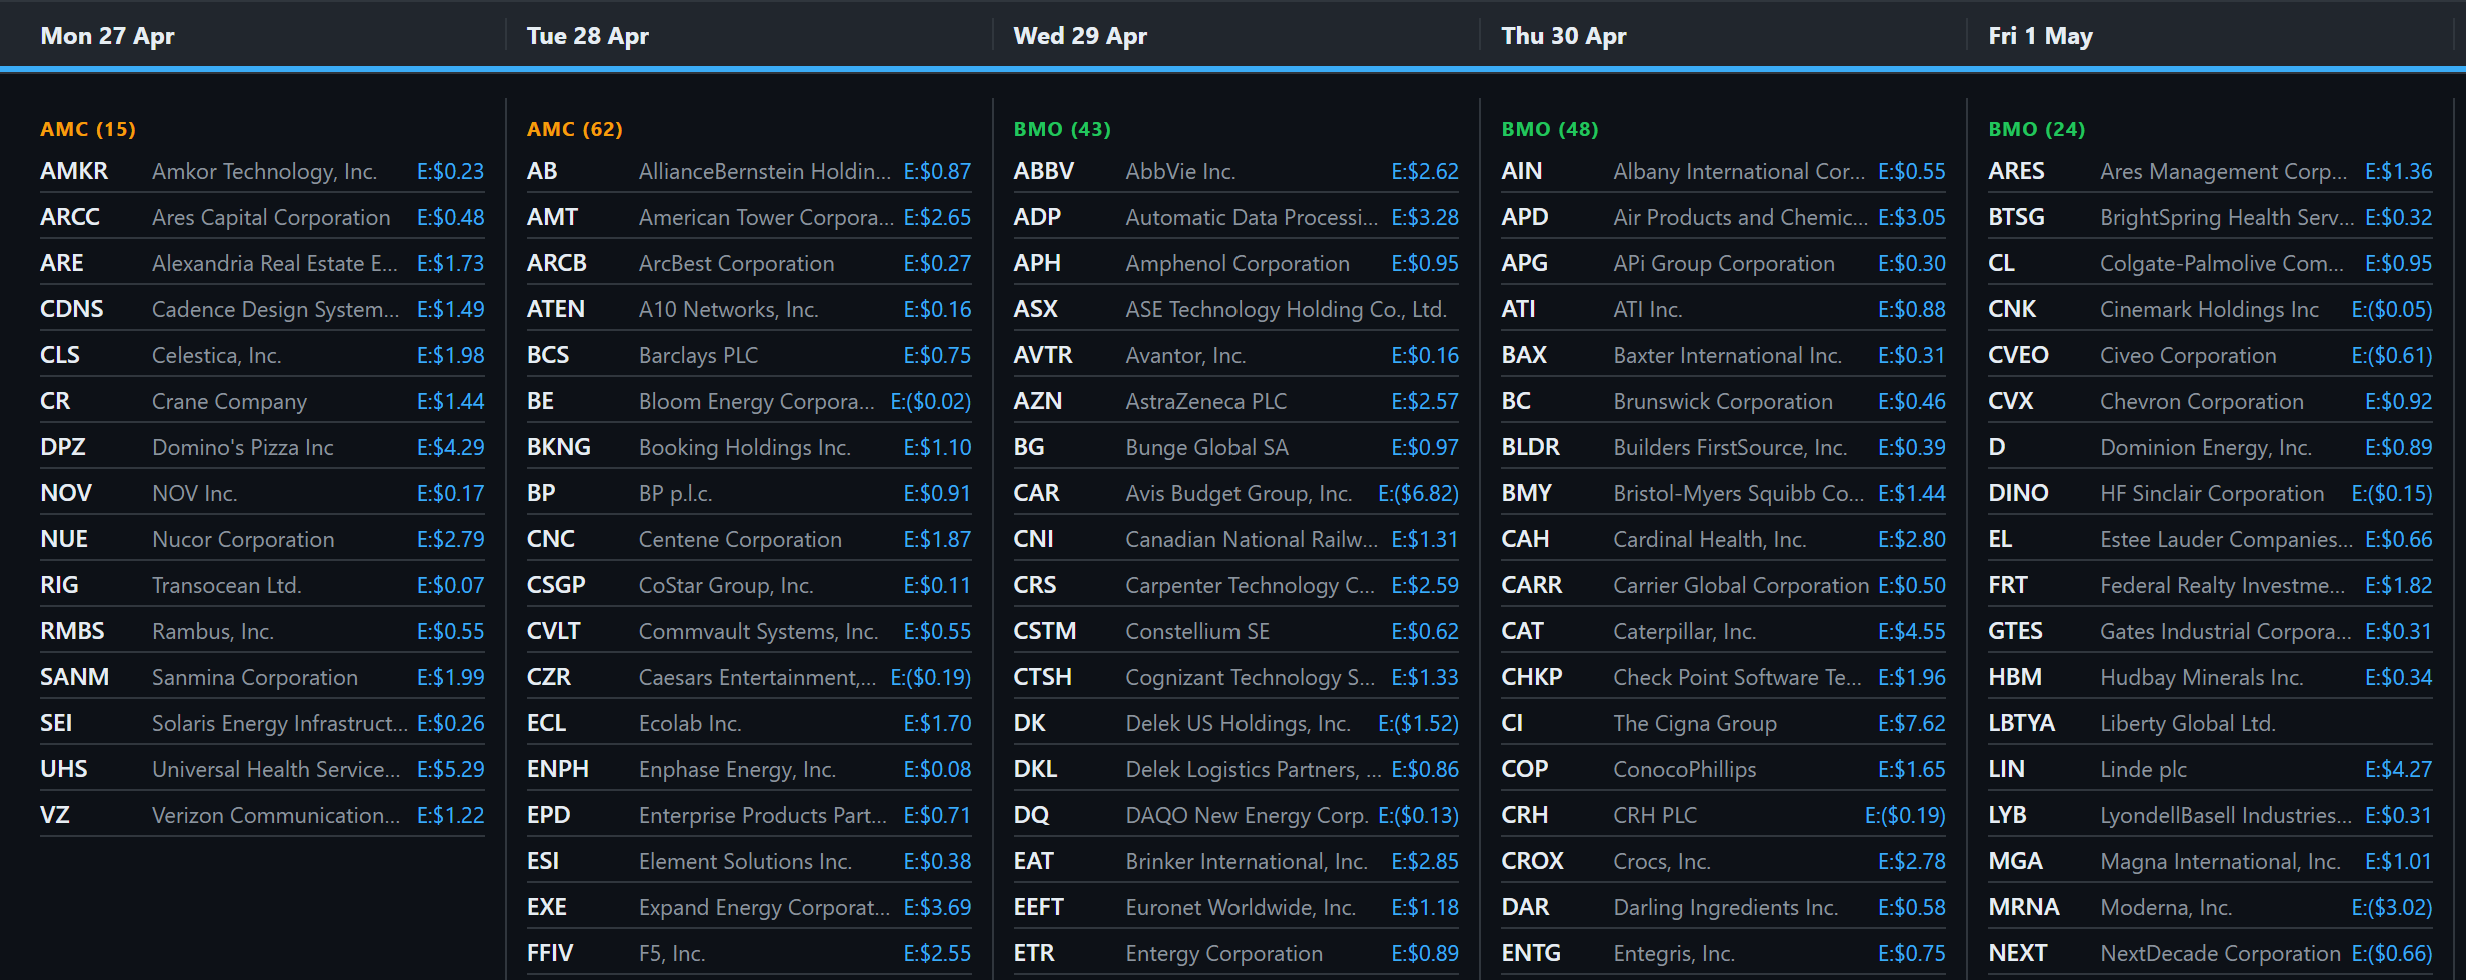
Earnings Calendar
The Earnings Calendar tab shows the current week’s scheduled reports, filtered down to the names that appear in our options flow feed. Before-market (BMO) and after-market (AMC) releases are listed separately for each day of the week and sorted alphabetically so you can scan quickly.
This matters most for interpreting unusual options activity. Flow ahead of an earnings release trades differently to flow in a name with no near-term catalyst - the risk profile is different, the timeframe is compressed, and the positioning logic changes. Having the earnings schedule visible alongside the flow feed, without needing to cross-reference a separate calendar, removes one more step from the process.
If a name is printing heavy call flow on a Tuesday and it reports on Thursday morning, that is a materially different trade to the same flow on a name with no catalyst for three weeks. The calendar keeps that timing visible at a glance.
How to Access It
The ETF Earnings Coverage dashboard is available to all Rhodie House Discord members.
A full walkthrough of all three tabs, including a column-by-column reference guide and notes on how the weight tier thresholds work, is available via the Guide button at the top of the dashboard.
ETF holdings data updates weekly. The earnings calendar updates each week with the current schedule. Both are pre-loaded on Friday evenings so the data is ready from Monday morning.