
Dark Pool Intelligence

About 40% of US equity volume trades off-exchange every day. None of it shows on the lit tape. None of it moves the NBBO in real time. And for most retail participants, it does not exist.
It exists. It is just happening somewhere else.
Dark pools are used by institutions managing positions too large to execute on exchange without moving the price against themselves. When a fund buys several million shares of a name in a single block, they are not being quiet because they are uncertain. They are being quiet because they are certain enough that they cannot afford to let anyone else see them coming.
My Dark Pool Intelligence dashboard surfaces those prints. Filtered by size, organized by name, and overlaid on price so you can see not just what happened but where it happened.
Whale Thresholds
Not every dark pool trade carries information. A brokerage routing a small retail order through an internalizer is technically dark pool activity. It means nothing. The dashboard filters by minimum size thresholds relative to market cap tier, so what you see is what institutions are doing, not what everyone else is doing.
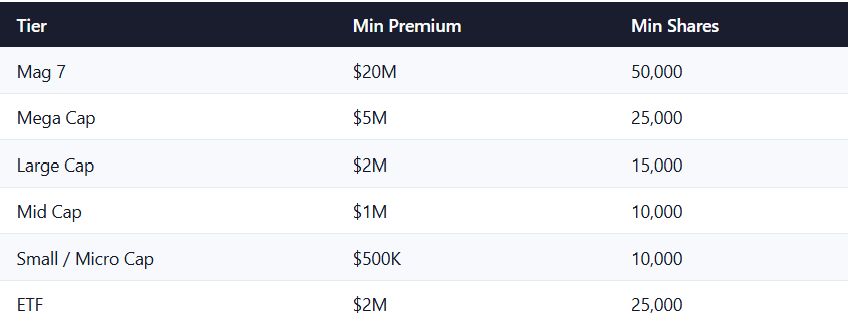
There is a second qualifier alongside the dollar and share thresholds. Any print representing 20% or more of a stock’s average daily volume qualifies automatically. In smaller names, position sizing relative to float often says more than the raw dollar value does.
Reading Side
Dark pool trades do not have a formally declared buyer or seller. Side is inferred from where the print executes at the time of the trade. A print at or above the offer is buyer-initiated. At or below the bid is seller-initiated. Inside the spread is ambiguous and flagged as such.
This is the same method institutional desks use to classify block prints. It is not perfect. A patient institution can time an execution to obscure direction. But across a series of prints in the same name it is accurate enough to be useful, and a cluster of buyer-initiated blocks at the same price level over several sessions is hard to argue with.
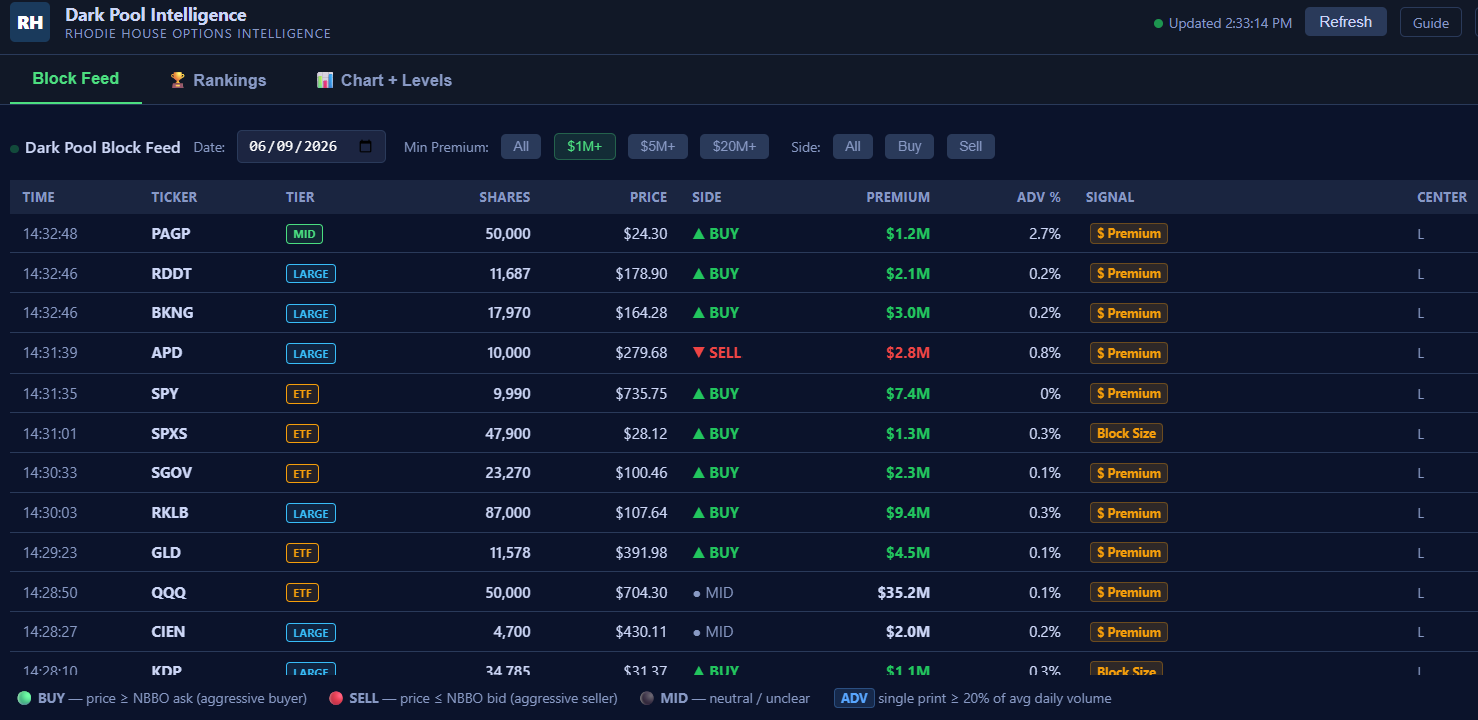
Block Feed
The first tab is the live feed. Every qualifying whale print appears here as it is captured, with ticker, size, price, premium, inferred side, and the reason it qualified. The feed is date-selectable. You can look at today, or go back to any prior session and see the full block activity for that day.
The goal is simple. A large institution just moved serious size in a name. You should know that it happened.
Rankings
The second tab aggregates whale block premium by ticker. The result is a ranked list of names by total institutional dark pool activity across whatever date range you select.
A single large block in a name is interesting. The same name ranking near the top week after week, consistently on the buy side, is a different kind of signal. It is the difference between someone taking a position and someone building one. The rankings panel separates buyer-initiated and seller-initiated premium so directional weight is visible at a glance.
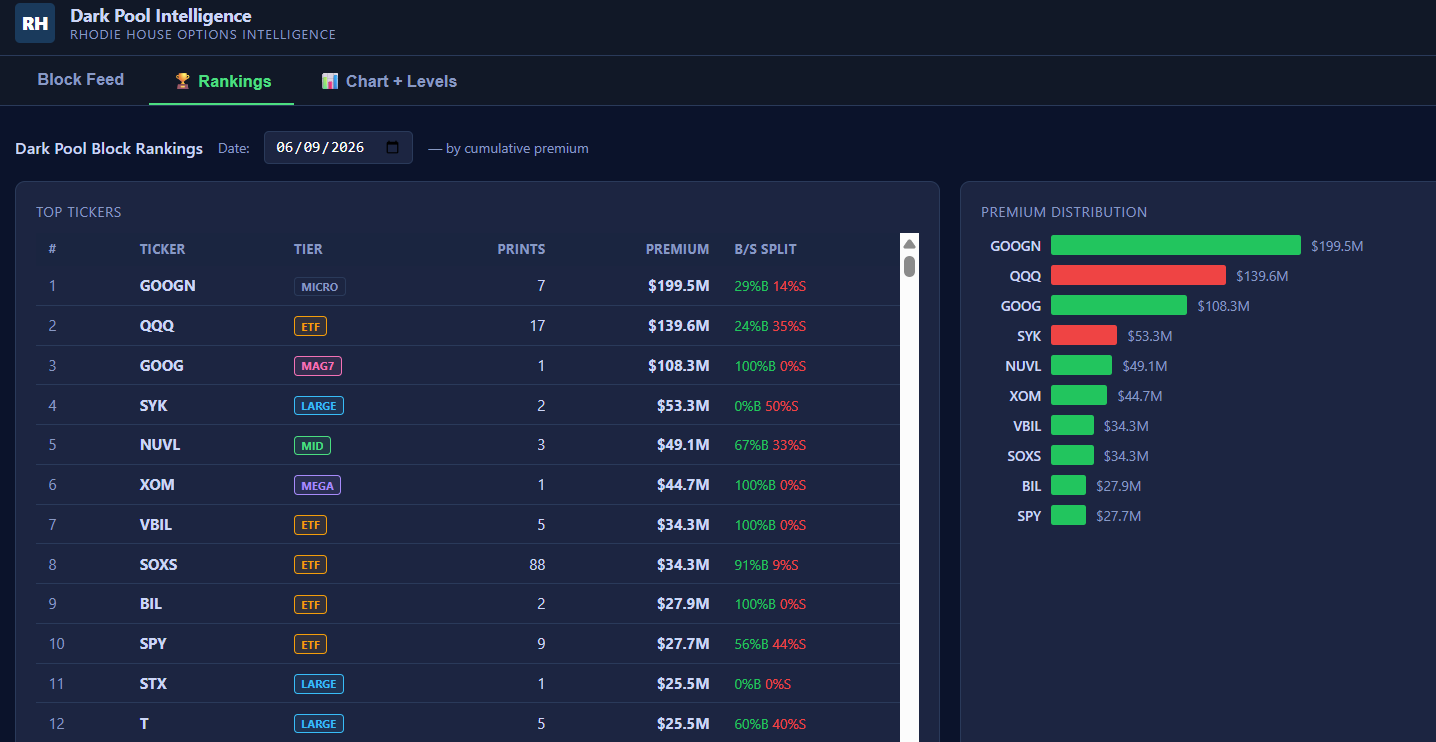
Note: Alphabet’s (Google’s parent company) newly issued mandatory convertible preferred stock trades on the NASDAQ under the tickers GOOGM and GOOGN. GOOGN: Shares of convertible preferred stock that are exchangeable for Alphabet Class C common stock
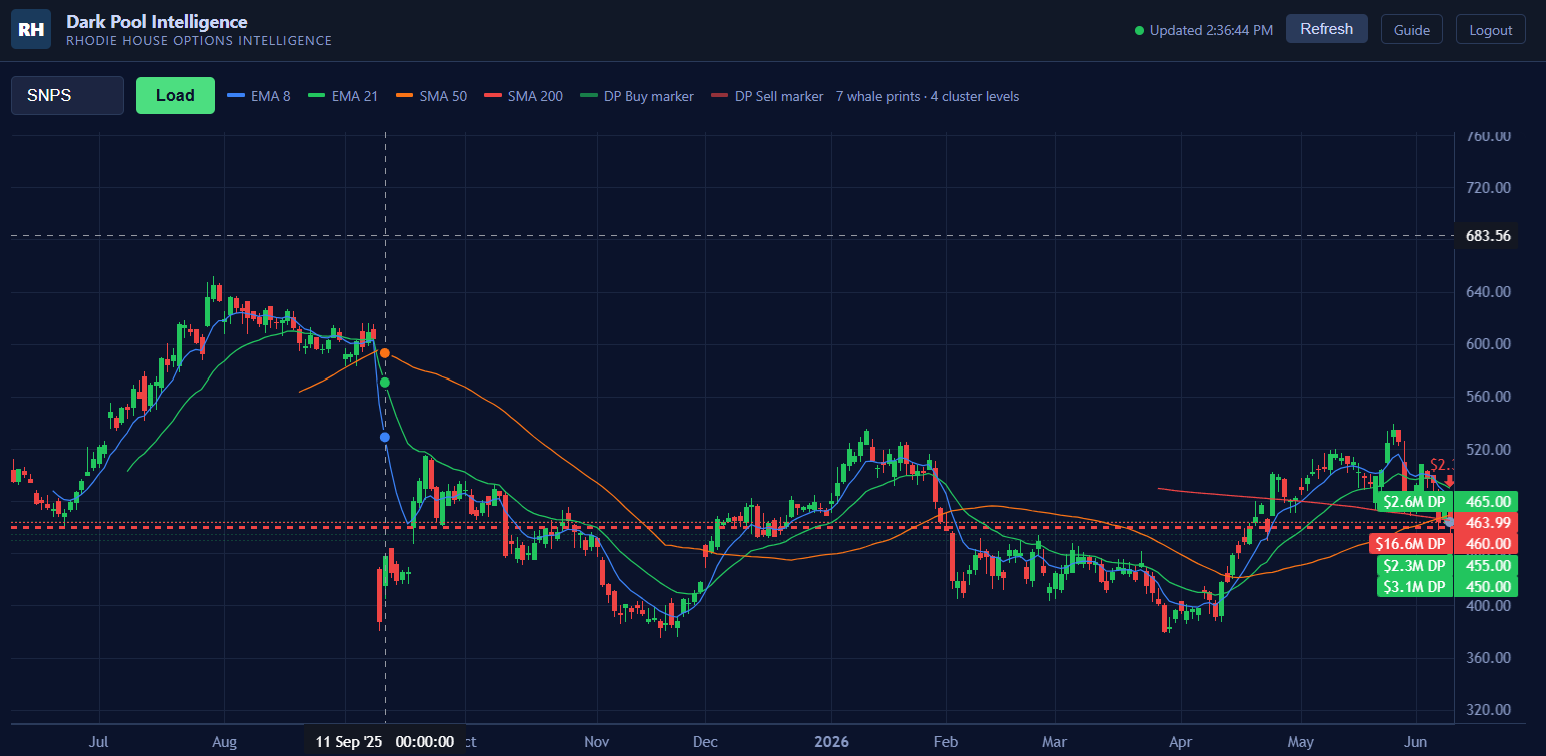
Chart and Levels
The third tab overlays block prints directly onto a price chart for any ticker in the feed. Each whale print appears as a marker at the price and time it executed.
Context is what makes a print meaningful. A large buyer-initiated block at a key support level is a different data point from the same size print in the middle of an extended move. When multiple blocks cluster at a similar price across several sessions, those levels are worth marking. An institution was comfortable accumulating there. The market will probably revisit that price at some point, and someone will remember where the size came in.
What to Watch For
Clusters near key levels. When whale blocks repeatedly execute at the same price over several sessions, that price is meaningful to at least one large participant. Watch for a reaction when price comes back to it.
Size growing over time. A fund building conviction tends to increase position size as the thesis develops. A name where block sizes are increasing session over session, on the same side, is different from one where size is stable.
Flow diverging from price. Stocks that are selling off on the lit tape but showing sustained buyer-initiated dark pool prints are sometimes being accumulated by institutions who are not in a hurry to see the price go up yet. The direction of block flow versus the direction of the stock is sometimes the more useful data point.
Cross-market alignment. An unusually large options position in a name combined with dark pool block accumulation in the same direction, in the same window, is the scenario where both datasets are telling you the same thing. That convergence is rare. When it appears, pay attention.
Access
The Dark Pool Intelligence dashboard is part of the Rhodie House Options Intelligence trading platform and available to members. It updates continuously during market hours.