Market Overview
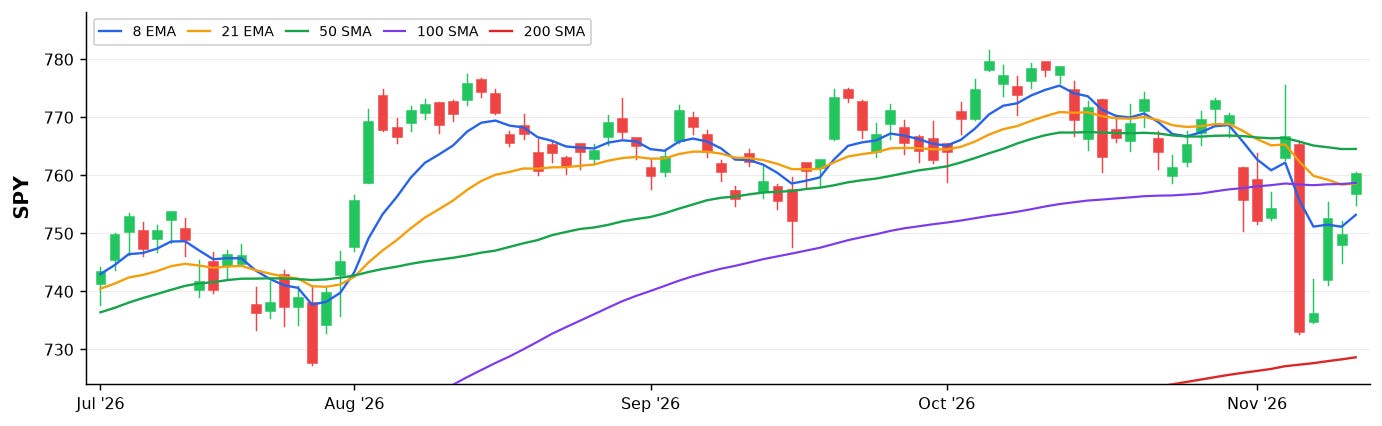
SPY is pushing back above the 21 EMA today, currently at 760.36 against a 21 EMA at 758.59, but this is could be just one close above it after a brutal drop from 769 down to 733 over a few sessions. The 8 EMA at 753.20 is still well below the 21, and that bearish spread between them tells you the structure hasn’t healed yet. The 50 day at 764.56 is the next real test overhead, and that’s only about four points away. VIX at 17.8 is calm enough but doesn’t give the all-clear here. We want to see follow-through over the next few sessions before trusting this bounce.
The dominant theme in flow this morning is a split between near-term hedging and longer-dated bullish conviction. QQQ is seeing serious put buying, including a ratio bear put spread layering on downside protection into year-end, while SPY is picking up both call buying and put selling near current levels, suggesting some players are fading the recent weakness. On the single-name side, SNDK is getting hit with put flow across two expirations, and NVDA is seeing April put buying, while MRNA and OKTA are attracting meaningful bullish structure. The bullish and bearish flows are roughly balanced, which fits the indecisive tape we’re seeing today.
A notable trade worth high lighting today is this:
IBIT
Risk Reversal and Bull Call spread

IBIT is sitting right on the 200 sma and this player is looking for a break out from there partly financed by puts $17 below where it is now. Not sure what catalyst would make IBIT move from here but this is a very big trade for someone to put on
I have also seen other trades posted online today that are incorrect - like these for example:
TTMI
This has been posted as TTMI $80 calls in February bought 1900 x
It’s actually a multi leg call spread and opening is unconfirmed.

FROG
This is another example - posted as sold puts. This has run up nicely and maybe has more room to run but just because the puts are deep ITM it doesn’t mean they are sold. This is likely a synthetic short. There is nothing to support it being sold - just look at how it was executed and how the MM moved his bid offer after the first smaller trade.


50 x at the ask - MM moved his offer up and second bigger 949 trade then recorded at mid. This is a near term trade in a relatively liquid name - it was not crossed and there is no evidence that it was traded on the bid.
These are good illustrations of why my flow is so accurate. I see so much flow that is wrong that no one questions (or has the ability to question) and then they are using it for directional intelligence when it is plainly wrong.
Top Setups — 2 Signals
APD — BULL · LARGE
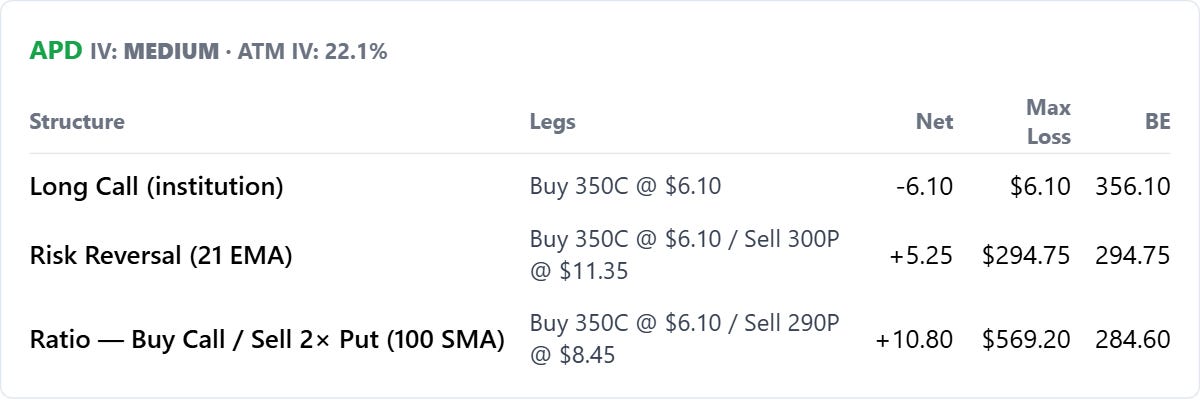
Calls Bought · Strike: 350 · Exp: Mar27 · 2486 contracts · $1.5M
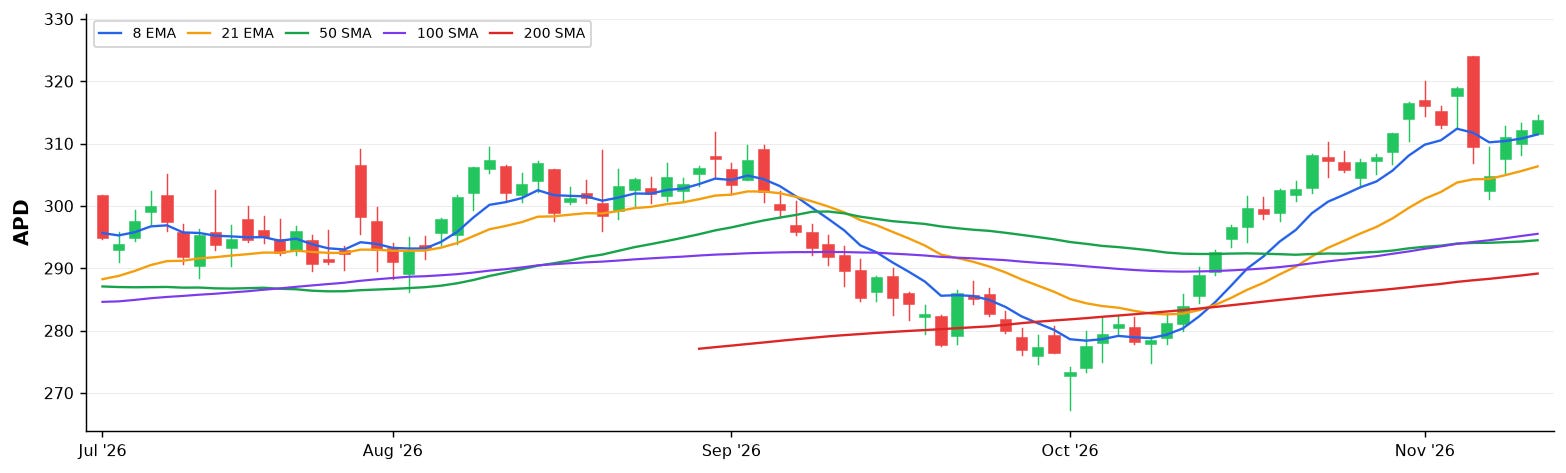
APD is sitting at 313.88 with the EMA stack fully aligned, 8 EMA at 311.49 above the 21 at 306.35, above the 50 at 299.60, and the weekly structure is clean with higher highs and higher lows above both the 50 and 200 week. The stock just crossed back above the 21 EMA recently, so a pullback toward the 21 at 306.35 is a reasonable entry level to watch, especially with XLB outperforming SPY by nearly 9%. Someone put $1.5M into March 350 calls, which is a patient bet on continuation with plenty of time to work.
CBOE — BULL · LARGE
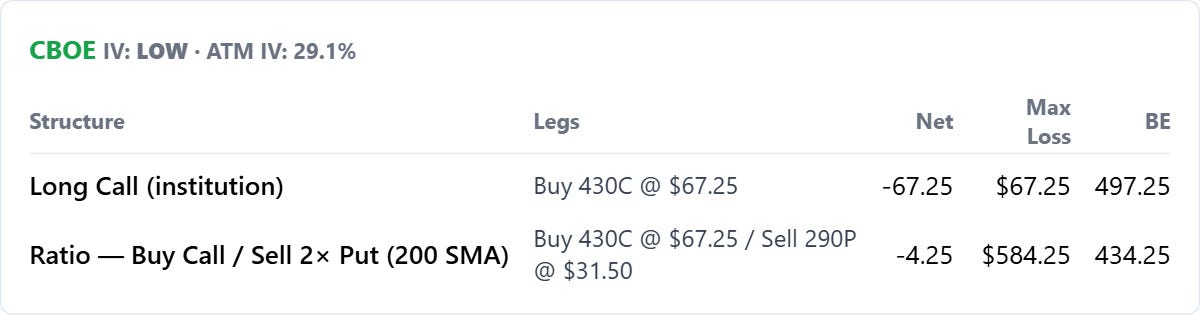
Calls Bought · Strike: 430 · Exp: Jan29 · 279 contracts · $1.9M
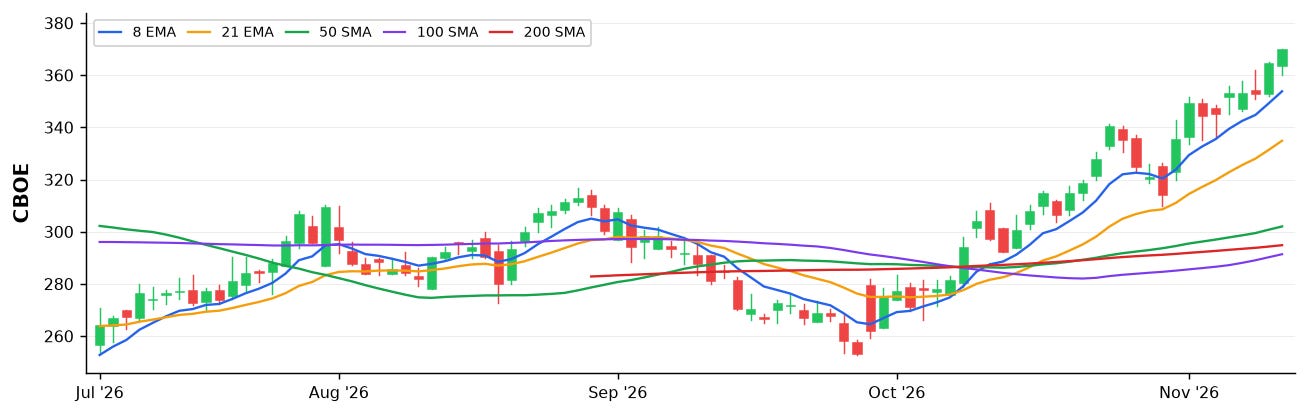
CBOE has been an absolute freight train, up from 301 to nearly 370 in 20 days, and the 8 EMA at 353.80 is the nearest dynamic support worth watching since the stock is running well above the 21 EMA at 334.87. The flag here is that price is stretched 2.3 standard deviations above the 8 EMA, so chasing right now is a low-probability entry and you want to let this breathe before getting involved. That said, two separate $1.9M call buys at the 430 strike out to January 2029 signal serious long-term conviction, so keep this one on the radar for a pullback toward the 8 EMA.