
Rhodie House Options Intelligence - Substack Introduction:

Reading the Tape: A Framework for Trading Unusual Options Flow
How to combine institutional positioning, technical structure, and market context into a disciplined, repeatable trading process.
Rhodie House Options Intelligence • March 2026 •
There is no shortage of options flow data available to retail traders today. What remains scarce is a coherent framework for translating that data into actionable trades. This piece lays out the process I use - one that treats flow as a starting point rather than a signal, and reserves execution for moments when multiple independent factors align.
None of what follows is a system you run on autopilot. Markets change, sectors rotate, and the macro environment that shaped yesterday’s best trade may render the same setup irrelevant tomorrow. What this framework offers is a repeatable process for filtering noise, identifying opportunity, and entering trades with genuine edge.

I. Options Flow: Signal vs. Noise
The daily options tape is enormous. Thousands of contracts trade every session across hundreds of names, and the vast majority of that activity is hedging, rolling, or routine institutional rebalancing - none of it actionable. The job is to filter down to the subset of trades where someone with significant capital made a deliberate, directional bet.
What you are looking for is size, conviction, and repetition. A single large block trade in an illiquid name tells you relatively little. But when meaningful call buying accumulates in a large-cap name over several sessions - particularly in strikes and tenors that imply a real directional view rather than a hedge — you have something worth examining.
The flow itself is never the trade. It is the beginning of the research process — a prompt to pull up the chart and ask whether the institutional thesis makes sense given the technical structure.
Put sales deserve particular attention. When a fund sells puts at a given strike, they are either expressing a willingness to own the stock at that level, or defending a position they already hold. Either way, it defines a price point where significant capital has staked a claim. These levels frequently act as technical support precisely because the entity that sold those puts has a financial incentive to protect them.
Large out-of-the-money calls bought on the offer, with meaningful time remaining, represent a different signal: someone is buying optionality. They are not hedging. They believe the stock is going materially higher and have chosen leverage to express that view. The relevant questions are: what is the implied move, what is the timeframe, does open interest confirm this is new positioning, and does the chart structure support the thesis?
Beyond the smart money and contrarian reads, flow surfaces two other categories of signal that are frequently underappreciated. The first is insider positioning. Executives and directors buying calls or selling puts in their own company - within legal disclosure windows - can be as informative as any institutional block. The options market is also, historically, where genuinely illegal insider activity shows up first: unusual size in out-of-the-money calls in a quiet name, days before a significant announcement, is a pattern that has appeared ahead of enough corporate events to treat it as a distinct signal category in its own right. You are not necessarily replicating the trade - but you are paying attention to something that the broader market has not yet priced. The second is unusual activity in names that rarely see options flow at all. When a company that generates almost no options volume suddenly attracts a large, structured, opening position, the absence of prior activity is itself part of the signal. There is no existing options market to hedge against, no routine positioning to explain it away. Someone made a deliberate decision to use the options market in that name on that day, and that decision deserves attention.
II. Technical Confirmation: The Chart Is the Answer
Flow tells you that smart money is interested. Charts tell you whether the price structure supports acting on that interest. These two inputs are not interchangeable - each answers a different question, and a position built on only one of them carries unnecessary risk.
The moving average framework I use is layered by timeframe and purpose:
8, 10, and 21-period EMAs : short-term momentum. Price above all three with the stack in order signals active accumulation. A sustained close below the 8 EMA is a warning sign worth respecting regardless of the longer-term thesis, particularly for swing positions measured in days to weeks.
50 and 200-period SMAs : the trend regime. The relationship between these two is one of the most reliable macro filters in technical analysis. When the 50 crosses above the 200 - the golden cross - the structural backdrop for long positions has fundamentally improved. When the 50 crosses below the 200 - the death cross - the burden of proof shifts heavily against new longs.
50, 100, and 200-period DMAs : key support and resistance architecture on daily and weekly charts. These are the levels where institutional entries and exits have historically clustered, and where disciplined traders place their orders.
The golden cross and death cross are not perfect, no single indicator is, but they define the regime within which all other analysis happens. Getting these right on both the index and individual stock level is foundational.
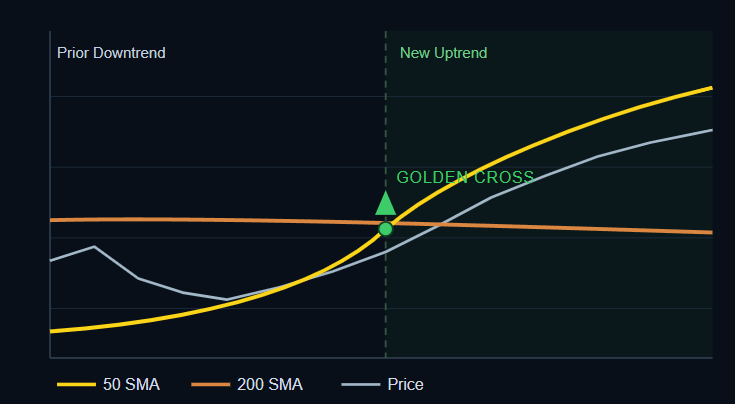
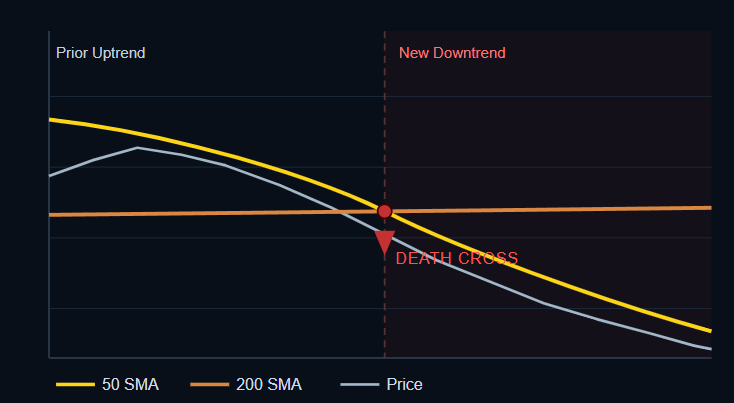
These crossovers matter most at the index level because they define the macro environment within which individual stock analysis happens. A golden cross on SPY does not guarantee that every long succeeds but it substantially improves the statistical backdrop. A market trading below its 200 SMA with a confirmed death cross is not a market to build large long books against, regardless of how compelling the individual flow looks.
Timeframe selection is equally important. A stock can look extended on the daily chart and perfectly positioned on the weekly, both observations are simultaneously true, and the relevant one depends entirely on your intended holding period. Short-term trades live on the daily and 4-hour chart; entries should respect the EMA stack. Positions with weeks or months of runway are built from the weekly chart, where the EMA and SMA framework applies at a structurally higher level.
Key Principle
A stock in a weekly uptrend that pulls back to its 10-week EMA is not breaking down - it is offering an entry. The same price action that looks alarming on a daily chart is entirely routine and healthy in the context of a longer-term trend. The ability to distinguish a trend continuation correction from an actual trend reversal is one of the highest-value skills in this process.
Stock Cycles: Where on the Map Are You?
The moving average framework above answers the question of trend direction. Stage analysis answers a deeper one: where in its lifecycle is this stock right now? The answer changes everything about whether a trade is worth taking and what the appropriate structure looks like.
Every stock moves through four identifiable stages. Stage 1 is accumulation - the stock has stopped falling and trades sideways as supply and demand reach equilibrium. Smart money builds positions quietly here; nothing appears to be happening, which is precisely why retail traders ignore it. Stage 2 is the advancing phase - the stock breaks above its key moving averages on meaningful volume, begins making higher highs and higher lows, and enters the phase where the majority of its gains are made. This is where you want to be positioned. Stage 3 is distribution - momentum fades, the stock moves sideways again after an extended uptrend, and the 30-week moving average flattens. Smart money is reducing exposure; the trade looks fine until it does not. Stage 4 is the declining phase - price breaks down from the Stage 3 top, and longs have no business here regardless of how compelling the flow or the story might appear.
The Four-Stage Stock Cycle
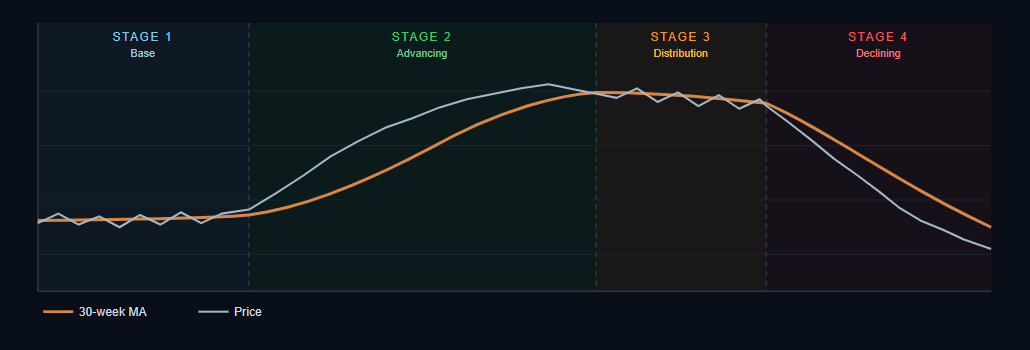
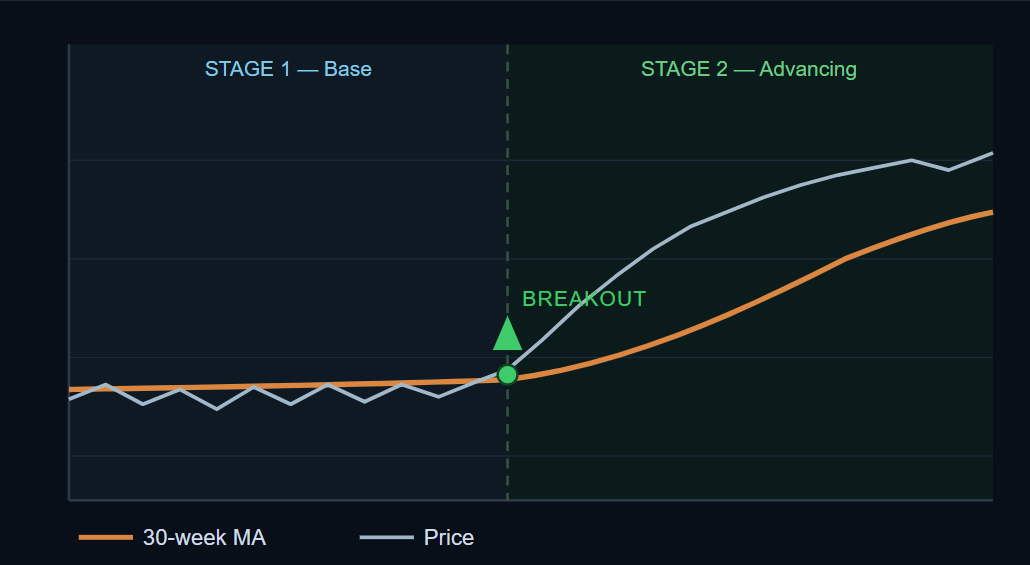
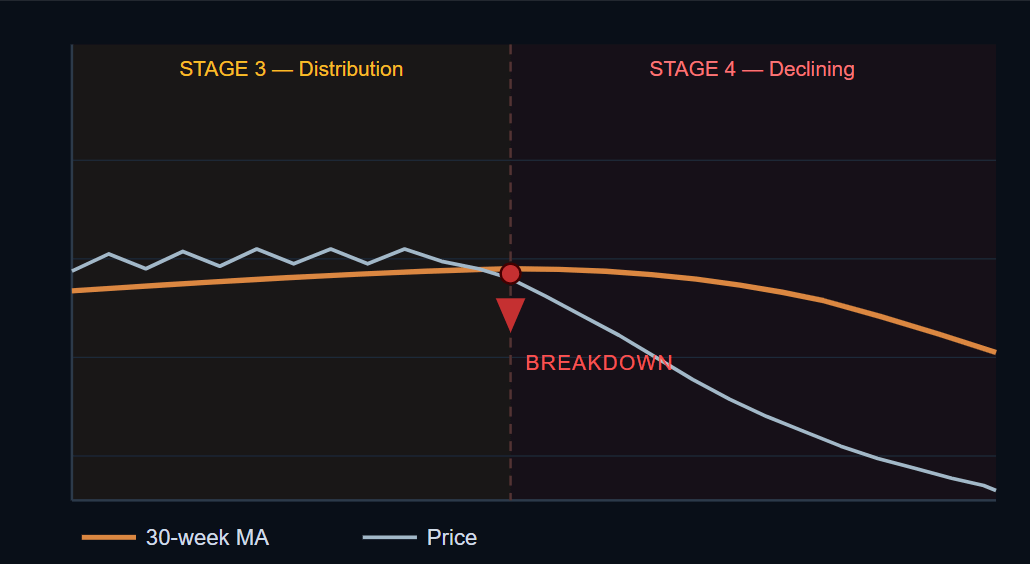
The practical application is straightforward. The highest-probability long entries occur at the Stage 1 to Stage 2 transition when a stock that has been basing begins to break out above its 200-day SMA with volume confirmation. The worst entries occur in Stage 3, where a stock still looks strong but the structure has quietly shifted against you. Stage 4 is a hard rule: no new longs, full stop.
The connection to flow is direct. Institutional accumulation during Stage 1 rarely announces itself loudly but it shows up in the options market before it shows up on the price chart. Persistent call buying or put selling at key strikes in a name that has been basing for months is often the first visible signal that a Stage 2 advance is being prepared. By the time the breakout is obvious, much of the move has already been priced in for the traders who read the flow correctly. Conversely, large put buying or call selling in a name that has been in a prolonged uptrend is frequently Stage 3 distribution made visible, the same institutional players who drove the advance beginning to hedge or unwind before the retail crowd recognizes what is happening.
III. Macro Context: Trading With the Wind, Not Against It
No individual stock trade exists in isolation. The macro environment determines how much tailwind or headwind every position faces, and ignoring it is one of the most consistent ways to take avoidable losses.
The VIX is a pricing signal as much as a sentiment indicator. When implied volatility is structurally compressed, VIX is in the low teens, options are inexpensive in dollar terms but offer poor risk-adjusted value for premium sellers. You collect little for the risk you take on, and the asymmetric reward for well-timed longs is diminished. When the VIX spikes above 25-30, the calculus reverses: premium becomes genuinely rich, fear-driven selling creates mispriced opportunities, and the probability-weighted return on disciplined premium selling improves substantially. VIX spikes are, historically, mean-reverting events. Equities recover. The trader positioned before that recovery, when premium was richest and conviction was lowest, almost always benefits.
Sector context is a filter, not an afterthought. A strong stock embedded in a deteriorating sector faces a persistent gravitational pull that individual trade thesis alone cannot overcome. Before committing to any position, identify the relevant sector ETF : XLK, XLF, XLE, XLV, XLY, and so on and assess whether it is in a period of institutional accumulation or distribution. The best risk/reward setups are found where individual strength aligns with sector strength.
Index structure sets the regime. Assessing SPY, QQQ, and IWM through the same moving average lens applied to individual stocks is the first step of any session, not an afterthought. A market where the major indices are below their 200 SMAs with deteriorating breadth demands extreme selectivity and reduced sizing. The same framework applied to a market in a confirmed uptrend with healthy internals supports more aggressive positioning in the best setups.
IV. Execution: Patience, Precision, and Position Structure
Identifying the right name, at the right time, in the right macro context is necessary but not sufficient. Entering at the right price, in the right instrument, with the right sizing is what separates a coherent process from a profitable one.
On cash-secured put sales as a primary entry vehicle: The preference for selling puts over simply buying stock at the current price rests on a straightforward structural logic. If you want to own a stock at a given level and it is currently trading above that level, you face a choice: pay the current price and accept the immediate mark-to-market risk, wait passively and receive nothing, or sell puts at your target level and get paid to wait. The third option is almost always the superior risk-adjusted entry — you define your price, collect premium that reduces your effective cost, and retain the option to walk away if the thesis changes before expiration. The key moving averages discussed above provide the natural strike levels.
The exception is when the magnitude of the expected move is large enough that the leverage of outright calls dominates. A long-dated in-the-money call in a stock you believe could double over 18 months offers a potential return that no put sale can replicate. These trades require higher conviction and more careful position sizing, but they belong in the toolkit when the conditions justify them.
On position sizing: Conviction should drive allocation. Spreading capital equally across twenty positions regardless of quality is not diversification, it is an admission that you have no real view. The names where flow is unambiguous, charts are textbook, macro is supportive, and entries are at key levels deserve meaningful allocation. The names where only one or two of those factors are present deserve proportionally smaller sizing, if any at all.
On the discipline of waiting: Most entries that work do not require urgency. A stock that has attracted institutional attention, is technically sound, and is pulling back toward a key level will present multiple valid entry points over the course of days or weeks. Forcing an entry out of fear of missing a move is a form of impatience that the market consistently penalizes. Define your price level and let the market come to you. If it does not, the premium you collected expires worthless and you move on to the next setup with your capital intact.
On Knowing When Not to Trade
Some of the most important capital preservation decisions in options are not trades at all, they are deliberate decisions not to deploy. When the VIX is structurally suppressed, sector rotation is unclear, and the index structure is ambiguous, the appropriate new position size is often zero. Discipline is not just about how you enter, it is about recognizing when the setup does not yet exist and having the patience to wait for one that does.
V. Putting It Together: The Full Process
The framework described above becomes a repeatable edge when the steps are sequenced consistently:
Screen the flow daily. Focus on large-cap names with size, conviction, and multi-session accumulation. Weight put sales at technical levels and large-premium, out-of-the-money call blocks with meaningful time remaining above smaller, shorter-dated activity.
Assess the macro regime first. Check the index structure and VIX level before any individual name analysis. An unfavorable macro environment substantially reduces the base rate of individual long trade success.
Evaluate the sector. Strong stocks in weak sectors are traps. Strong stocks in strong sectors with supportive flow represent the highest-probability setups in this process.
Analyze the chart across timeframes. Use the weekly for trend structure and primary support/resistance levels. Use the daily for entry timing and EMA alignment. Confirm the moving average configuration is consistent with your intended holding period.
Select the instrument. The magnitude of the expected move and the IV environment determine whether long calls or put sales offer the better risk/reward. This decision should be made deliberately, not by default.
Define the entry level and wait for it. Set a specific price; typically a key moving average or established support zone and do not pay above it. The discipline of waiting for your price is often the difference between a trade with edge and a trade that merely feels urgent.
Establish exits before you enter. A sustained close below the 8 EMA on a short-term trade warrants an exit. A weekly close below the 50 SMA on a longer-term position demands a serious reassessment. These rules exist to prevent losses from becoming catastrophic, and they only function if defined before the position is on.
How I Built the Tool — and Why It Took Years to Get Right
I have been reading the options tape for long enough to know what it looks like when someone is building a real position. There is a texture to it: the size, the structure, the strikes chosen, the timing relative to open interest; that tells you something is happening before the news does. Developing that instinct takes time. The problem is that instinct does not scale. You can only read so many prints in a session before the signal starts getting lost in the noise.
That frustration is what this tool was built to solve. Not to replace the judgment, that still lives with the trader, but to handle the mechanical act of reading every single print in real time, filtering out the noise, and surfacing the ones worth looking at, already interpreted, in the language I would use if I had spotted them myself.
The honest reason it needed to exist is that manual tape reading does not work, not really, not consistently, and not at scale. I know this because I tried. The problem is not effort or attention. The problem is that a human reading the tape manually will miss trades simply because too many prints are coming through at once. They will select sub-size trades based on the number of contracts rather than the dollar premium relative to the size of the company : 5,000 contracts in a mega-cap name is noise; 500 contracts in a small-cap is a statement. They will unconsciously lean toward names they already have positions in, looking for confirmation rather than signal. They will gravitate toward familiar tickers - the names they follow, the ones they have opinions on and miss the more interesting activity happening in names outside their usual field of view. And at some point in the session, fatigue sets in. Concentration drifts. A multi-leg structure comes through and one leg gets missed. A strike gets transposed. A put sale gets read as a put buy. These are not hypothetical failure modes - they are the ordinary, predictable limits of human attention applied to a high-volume, continuous data stream over the course of a full trading day. The tool exists because those limits are real, and because the cost of reading the tape badly is worse than not reading it at all.
What it is not: a black-box algorithm generating signals, a substitute for judgment, or a shortcut around the analytical process described in this piece. What it does is remove the layer of work where humans are most unreliable which is the mechanical act of monitoring, filtering, grouping, and labelling every print across the full market, without fatigue, without bias, without error so that the judgment it delivers to is clean.
How This Differs From Existing Flow Tools
There are other options flow platforms out there, and most of them share the same fundamental limitation: they compete on the volume of data they surface rather than on what they do with it. Open one of the well-known tools on a busy session and you are looking at an overwhelming stream of raw prints; every trade, every size, every name, all at once. To use any of them effectively you need to build your own filters, learn the interface in depth, and develop your own system for separating signal from noise. That process takes months. Most users never get there. They end up either ignoring most of what they see or, worse, acting on prints they have not properly evaluated because the volume creates urgency where there should be patience.
More fundamentally, these tools give you the raw material and leave the analysis entirely to you. Individual legs of a multi-leg structure arrive as separate line items — the connection between them is invisible unless you already know to look for it and have the experience to piece it together. There is no context around whether a print is opening or closing, no weighting for what a given notional figure means for a company of that size, no interpretation of what the structure actually says about the position being built. The tool surfaces data. The expertise required to make sense of it is assumed rather than provided.
What we have built starts from a different premise. The options knowledge, the ability to recognize a risk reversal from its legs, to understand what a put sale at a given strike and size tells you about institutional intent, to know when a large print is meaningful and when it is mechanical noise, is embedded in the tool itself, not left as homework for the user. You do not need to spend months learning a platform or constructing your own filter logic. The heavy lifting has already been done. What arrives in your feed is flow that has already been read by someone who has been reading the tape for years, interpreted, labelled, and sized correctly, so that your energy goes into the analysis and the trade, not the mechanics of finding it.
What the System Actually Does
1. Filtering Out the Noise First
The starting point is knowing what to ignore. The raw tape is overwhelmed with small retail fills, routine hedging activity, and index rebalancing that has no directional intent whatsoever. I have spent enough time watching flow to know that trades under a certain notional size, or with almost no time remaining, or in names dominated by mechanical index activity, are almost never worth the attention. Those get filtered immediately. What remains is a manageable universe of prints where real capital made a real decision.
2. Seeing the Whole Trade, Not Just the Legs
This is the piece that most flow tools completely miss, and it is the one I spent the most time on. When a fund puts on a risk reversal (selling puts to fund call purchases) those two legs arrive on the tape separately, seconds apart, looking for all the world like two unrelated trades. If you only see the individual legs, you misread the trade entirely. The same is true of rolls, spreads, collars, and ratio structures. The system holds a short buffer window, matches legs by ticker, size, and timing, and reconstructs the actual strategy before it surfaces anything. I have watched enough of these structures print live to know how they look when they come through and the system has been taught to recognize exactly that.
3. Naming the Trade Correctly
Once the legs are grouped, the system applies a classification library built directly from my own experience of what these structures look like and what they mean. Bull call spreads, bear put spreads, risk reversals bullish and bearish, collars, covered call overwriting, diagonal and calendar rolls, opening positions versus closing ones, each has a specific fingerprint in terms of strikes, expiries, bid/ask side, and relative sizing. The labels the system produces are the same labels I would write in my notes if I had spotted the trade manually. That consistency matters, because it is what makes the output searchable, comparable, and useful over time.
4. Reading the Context Around the Trade
The print itself only tells you part of the story. Whether it went up on the ask or down on the bid is the first question any experienced flow reader asks, it tells you who was the aggressor. How the size compares to existing open interest tells you whether this is new money entering or existing positioning being managed or exited. The market cap of the underlying changes how I calibrate the significance of a given notional figure - a $500K print in a small-cap name and the same print in a mega-cap name require very different levels of attention. The system weighs all of these simultaneously, the way I would, rather than treating each variable in isolation.
5. Improving With Every Session
The classification logic has been refined continuously against live flow. Every time a real trade comes through that does not fit neatly into an existing category, or gets labelled incorrectly relative to what the structure actually was, the system gets updated. This is not machine learning in the academic sense, but it is the same underlying process: pattern recognition refined by feedback over time. The knowledge embedded in the classification rules today reflects every unusual structure I have encountered and worked through. That library keeps growing.
The output is not a data feed. It is the tape as an experienced trader would read it — each alert already carrying the context, the structure label, the size relative to open interest, and the market cap framing that determines whether it deserves your attention. The analysis that used to happen in my head, and could only happen for a handful of prints before time ran out, now happens across the entire market in real time.
I still do the trading. The system just makes sure I never miss the trade worth seeing.
The edge in options trading does not come from any single indicator or data source. It comes from the discipline to require that multiple independent inputs align before committing capital — and the patience to wait until they do.
Flow identifies where sophisticated capital is being deployed. Charts confirm whether the price structure supports the thesis. Macro context determines whether conditions are favorable enough to act. Execution determines whether you capture the opportunity or leave it on the table.
Each piece, in isolation, is insufficient. Together, consistently applied, they constitute a process worth trusting.
Rhodie House Options Intelligence, March 2026
About the Creator Of Rhodie House Options Intelligence:
I spent thirty-five years at the highest seniority of institutional financial markets. My career began in structured products and financial engineering at a major bank, covering the full spectrum of derivative instruments and then structured credit. That work demanded a precise understanding of how complex instruments are constructed, how institutions use them to express views or manage risk, and what a trade structure reveals about the intent behind it.
I subsequently co-founded and built a specialist alternative credit asset management business that grew to over $4 billion in assets under management. I later co-founded and was CEO of a US government securities broker dealer, operating at the highest level of the US fixed income market, which grew to assets in excess of $30 billion.
I am now retired from institutional life and run my own family office, trading equities, fixed income, foreign exchange, and commodities across global markets. Across three decades and multiple institutions, the common thread was always the same: reading positioning, understanding what large pools of capital were doing and why, and knowing what it implied. Options flow is the purest expression of that discipline - institutional intent made visible in real time, for those who know how to read it.
I still maintain the FINRA Series 17, 24, 63, 66 and 99 licenses under the FINRA MQP - not because this platform requires them, but because operating to a high regulatory standard is a habit of thirty-five years that I have no intention of abandoning. Options Intelligence is not a brokerage or advisory service. What it is, is a professional-grade information platform run by someone who has always operated within a regulatory framework and understands exactly where the boundaries are.
Excited to see what you have come up with, Judah! Congratulations on launching.
What is the background about the name 'Rhodie House'?